# Footprint Introduction
Footprint——One Step Closer to Blockchain Insights

**Footprint is a powerful yet easy-to-use analytics tool to uncover and visualize blockchain data.**
**The product puts user experience first—whether you’re an analyst, data scientist, developer, student, teacher, or executive. It provides an intuitive, drag-and-drop interface for interactive data queries.**
# Official Links
Know more about Footprint
#### You can contact us via these links. Looking forward to being in touch with you.
`Official Website:` [`https://www.footprint.network/`](https://www.footprint.network/)
`Twitter:` [`https://twitter.com/Footprint_DeFi`](https://twitter.com/Footprint_DeFi)
`Discord:` [`https://discord.com/invite/3HYaR6USM7`](https://discord.com/invite/3HYaR6USM7)
`Medium:` [`https://medium.com/@footprintofficial`](https://medium.com/@footprintofficial)
`Telegram:` [`https://t.me/joinchat/4-ocuURAr2thODFh`](https://t.me/joinchat/4-ocuURAr2thODFh)
# 1-Will on-chain data be used to predict the next DeFi explosion?
Footprint makes it easy for anyone to analyze and visualize billions of blockchain transactions—here’s why that might change crypto investing.
Blockchain technology has been a hot topic ever since the emergence of DeFi in 2017. The explosion of cryptocurrencies, and new trends like NFTs, has attracted institutions, investors, projects, investment institutions, traders and data analysts.
All are on the hunt to explore new DeFi applications. The potential for wealth creation is evident.
But, the growth of DeFi projects and users has also led to an explosion of on-chain data. The growing value of this largely untapped spring of information is perhaps the most significant trend underlying the industry's future.
### **What’s the big deal about on-chain data?**
Blockchain provides many benefits for data analysis that traditional data does not. Here are three of the main features:
**1.A massive volume of high-quality data**
Once all blockchain data is verified and approved, these records become tamper-evident.
With the rapid growth of users and businesses, the volume of data is becoming massive beyond what anyone could predict or foresee.
**2.Traceability and personalization**
Blockchain records include all the information necessary to track their origin and live text. This includes which address initiated the transaction when it occurred, the amount of the asset transferred the recipient address and transaction fees.
While all on-chain data is traceable, cross-chain and cross-platform data are more complicated since they include frameworks from different developers. \
\
**3.Decentralization and anonymity**
Traditional institutions often can’t access comprehensive and accurate information about users because their private data is protected.
With the decentralized, anonymous property of blockchain, every transaction datum is public, taking the limits off data mining and analysis.
### **Challenges for Effective On-Chain Analysis**
Blockchain is still a new technology. It’s fair to say that we are just beginning to understand and explore the value of the data it provides.
At this early stage, being able to collect, summarize and visualize data effectively is critical. Currently, most blockchain analytics tools focus on cryptocurrency quotes and compliance analysis.
Why?
Up to now, several roadblocks hinder creating powerful, easy-to-use analytics platforms for blockchain.
**1.Difficult to process data**
On-chain data is multi-platform, multi-chain, and multi-project. The first step of creating meaningful insights is to consolidate this massive amount—which includes processing each data source one by one to schematize data formats, highlight key events and understand the business logic.
Naturally, the access speed to do this task is plodding.
**2.Hard to import incremental data**
Different platforms and projects don’t always support users importing outside data for analysis. Users cannot combine data and events to discover macro trends.
**3.Platforms are incomplete**
The range of tokens, assets and DEXs available on platforms is limited, usually missing non-mainstream currencies, NFTs, and other highly relevant projects. Platforms also lack historical data, user behavior dimensions, and other vital events analysis capabilities.
**4.Lack of data applications**
Many analysis tools can help users find data, but they cannot help users apply it in ways that can answer their real-world questions. Particularly, attempts at data visualization fall short.
Most of the visualizations are single view charts showing particular blockchain measures over time. These single disconnected views make it challenging to relate multiple blockchain characteristics to each other.
**5.Poor analysis experiences**
Users generally have two options for selecting an analytics dashboard.
First, they can choose platforms that provide ready-made dashboards, severely limiting the type of data and analysis.
Second, they can select custom dashboards to import, fork and merge data tables. The problem lies in the fact that these tools are not beginner-friendly at all. They require coding and knowledge of SQL.
In other words, the threshold of operation is high. A custom analysis is essentially impossible for the many DeFi investors and enthusiasts who do not have these technical skills.
**6.Difficult to track address data**
Tracking the address behavior of centralized exchange wallets is not easy, especially when dealing with multi-wallet addresses.
As a result, current platforms cannot integrate multi-chain data for the same wallet and cannot track wallet behavior over time. This gives their visual charts a static quality which fails to capture transactions and movement as they happen in reality.
**7.Few tagging applications**
Tags make parsing through different tables, metrics, and dimensions efficient. However, there is a notable lack of tags based on behavior categories, business connotations, analysis scenarios, and other useful categories in the current data platform offerings.
Most platforms do not support custom tags—something that is a prerequisite in other industries dealing with data. Those that do support custom tags still lack tagging rules, which are guidelines for users to give definitions to the tags.
### **Footprint makes blockchain analytics possible for anyone**
Many blockchain-focused data analytics platforms have stepped in to make blockchain data accessible.
As the demand for blockchain analytics grows, these tools are becoming more effective and powerful, each serving the needs of different kinds of investors and businesses.
Footprint is one such platform. Built by a team of internet serial entrepreneurs, it is a one-stop analytics platform that helps you visualize your blockchain data exploration results with an effortless, easy-to-use, and user-friendly interface.
Footprint offers the following solutions for data analytics users.
**No coding or technical skills required**
Footprint solves the problem of exploring blockchain data and gives users an effortless drag-and-drop experience. There is no need for SQL queries or coding to analyze blockchain data—anyone can discover and present actionable DeFi insights with the sleek interface.
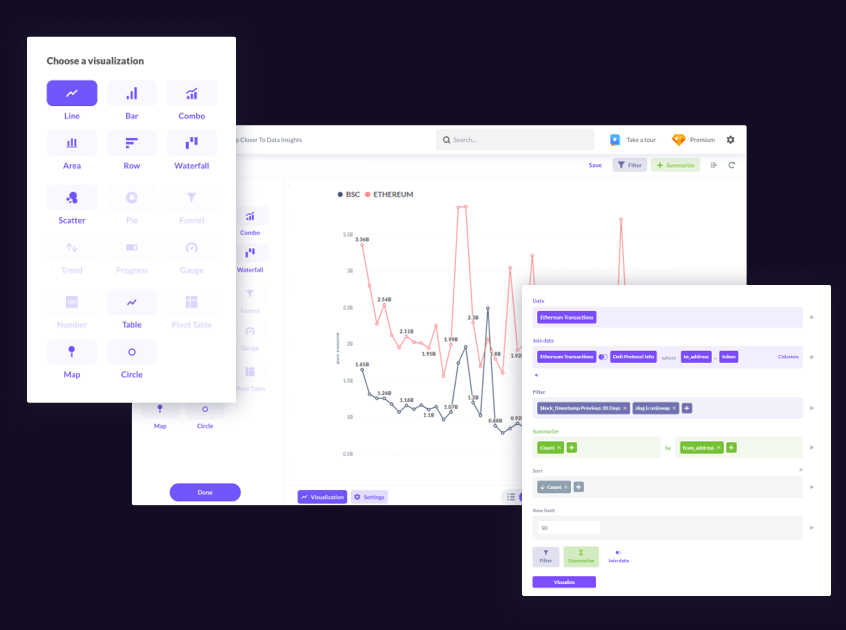
**Fork queries with one click**
Footprint provides rich data analytics templates that support forks with any open analytics table on the platform with one click, helping users easily create and manage personalized dashboards. Users can also share data tables and dashboards with partners or on social media.
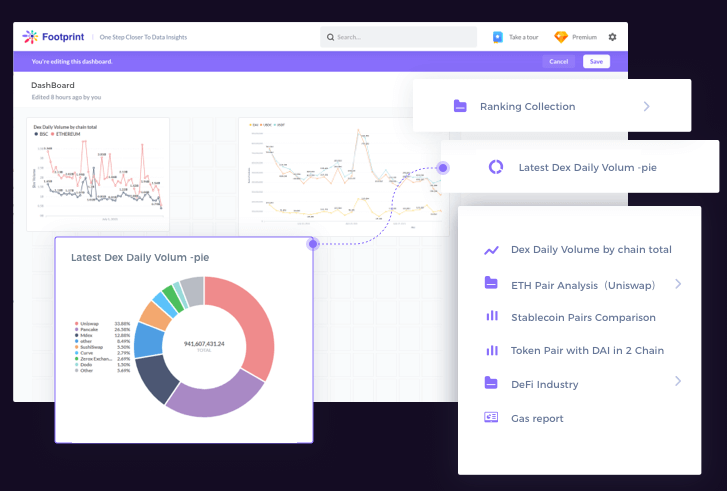
**Supports cross-chain data**
Subscribers get a platform that provides cross-chain and multi-project type data, supporting users to draw and analyze data charts by chain and project type.
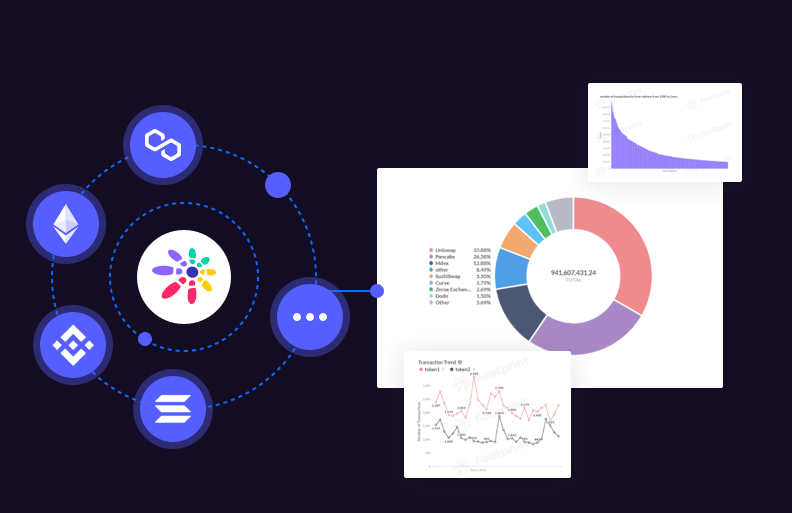
**Advanced wallet labeling**
The Footprint database has generated tags by category for the DeFi platform. And now it supports users to tag reports and dashboards, so users can quickly search for the report templates they need based on the tags.
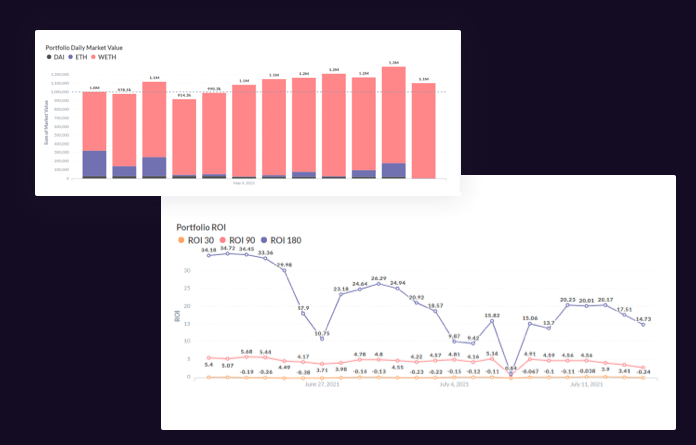
Underlying the usability of the platform are advanced wallet labeling capabilities. It tracks and labels every individual wallet address exchange, meaning users can see which addresses are accumulating or selling off specific tokens, plus their portfolio profits. This enables both hyper-targeted research and uncovering macro DeFi market trends. With token metrics for usage, engagement, and liquidity, users can make informed decisions before and after investing.
**Community-powered by DAO**
To push the possibilities of decentralization while building a supportive community, Footprint’s DAO brings together active, diverse and engaged members to inspire and support one another through forums. The decentralized organizational structure of the Footprint community allows its users to share insights and actively drive development.

### **Where will blockchain analytics take you?**
Cryptocurrency transactions involving multiple chains, projects, and wallets are an enormous challenge for developers and data analysts because of the data volume and complexity.
For data analysis platforms, collecting and organizing standardized data structures takes a lot of time and effort and requires constant investment in long-term maintenance. Because of the complexity of the data, most of the analytics tools on the market only realize the overall statistics or part of the chain's data, and there are almost no platforms that can provide microscopic data granularity that can be tracked to individual behaviors like Footprint.
With the development of the multi-chain ecosystem, data analysis will usher in development opportunities like never before.
As an early innovator in accessible analytics tools, Footprint will likely support the growing interest in DeFi with its pleasant, simple interface experience and powerful data capabilities.
# 1-TVL Gap between Uniswap and Sushiswap quickly narrowing

Author: Footprint analyst, Simon in July 2021
Following its launch in August 2020, Sushiswap has expanded by leaps and bounds nowadays, seemingly becoming a contender to Uniswap.
But what does the data say? Is Sushiswap poised to become the world’s leading DEX, or will it likely remain a niche exchange in the near future?
Using Footprint’s powerful analysis features, we can compare the performance of these two platforms according to the dimensions of TVL, volume, token price, and market capitalization to draw data-informed conclusions.
**TVL**

Starting in October 2020, SushiSwap began to take bites out of Uniswap’s market share. Although, from April to May of this year its TVL dropped, indicating it is still steadily on the rise.
After governments tightened regulation on cryptocurrencies in late May, causing cryptocurrencies to plummet, the gap between Uniswap and Sushiswap gradually narrowed. By July 25, the discrepancy of TVL between Uniswap and Sushiswap was only 17.5%.
**Volume**


According to the data from Footprint, Uniswap still accounts for around 40% of the DEX volume, widening the gap with SushiSwap, which is less than 10%.

However, in terms of the token volume, SUSHI (the token of Sushiswap) has been gradually overtaking UNI (token of Uniswap ) since May 2021, with the gap gradually narrowing. The volume of DEX tokens is a basic measure of DEX transactions, and higher volume means more gas fees from the protocol, which increases the value of these tokens.
**Price**

SUSHI is currently priced around $8, while UNI is around $18. It is worth noting that SUSHI holders have the option to stake their tokens and get xSUSHI for 16.6% of all fees generated by Sushiswap. Although UNI does not have this function, it has still performed better than SUSHI in terms of market gains.
**Market Cap**

Market capitalization is calculated by multiplying the circulating supply of a crypto asset by the price of an individual unit. Due to the difference in their circulation and the current large price gap between SUSHI and UNI, there is still a 6-fold difference in market capitalization.
**Summary**
In general, Sushiswap, which has been around for less than a year, is still some distance away from Uniswap. However, SUSHI is getting stronger in terms of price and other metrics. Sushiswap may have started as an offshoot of Uniswap V2, but it is now evolving into a new DeFi project that can stand on its own feet.
# 2-5 Stablecoins Growth Trends in Q2 2021

Author: Footprint analyst, Bella in July 2021
In the crypto world, stablecoins are a key medium in the market. The most common one among them is USDT, which continues to lead trading by having the highest cap and volume of trades. Other notable ones such as USDDC and DAI have been gradually climbing up thanks to their potential benefits of being closely integrated into DeFi scenarios.
Using the Footprint platform, we have analyzed and interpreted the top 9 stablecoins with the dimensions of market capitalization and transaction volume. Here's what we found:
**1.The market cap of stablecoins maintained a rapid upward trend in Q2 2021, reaching 107 billion by the end of the quarter, representing a 72.5% increase over Q1 2021. BUSD had the most significant increase, closely followed by USDC, DAI, and GUSD.**

**2.USDT continues to hold the lion's share of the stablecoin market in Q2 at 58.8%.**
As the crypto market continues to evolve, DeFi users and projects continue to turn to more compliant, secure tokens. USDC stood out in Q2 due to its compliance, expanding its share while gradually eroding USDT's leading position, playing an increasingly important role in the stablecoin market. According to Footprint, USDT's market share shrank from 65.9% to 58.8% in Q1, while USDC's market share expanded from 17.5% to 23.7%.
At this rate, USDC is catch up to, or even surpass, USDT sometime between late 2021 to early 2022.

**3.The increase of the market cap of decentralized stablecoins market cap is nearly twice that of centralized stablecoins.**
Centralized stablecoins continue to dominate the market cap, increasing by 290% from the beginning of the year, while decentralized stablecoins are up 400% from the beginning of the year, mainly attributed to DAI making gains of 350%.

**4.Stablecoin trading volume reached a peak in May 2021**
As more and more DeFi projects emerge, project owners have launched liquidity mining efforts using stablecoins, which has led to record-high use and transaction volume. According to Footprint, stablecoin transaction volume continued to rise in Q2 and reached a peak in May.
However, global regulatory turmoil caused the crypto market to suffer its biggest ever crash on May 19, taking down the transaction volume of stablecoins.

**5.DAI dominates the transaction volume of decentralized stablecoins**
According to Footprint, both **centralized** and **decentralized** stablecoin transaction volumes have been hit by by the fall of cryptocurrency prices in May 2021. Due to the rapid development of the DeFi lending market, DAI has gradually become the hard currency of major digital assets to circulate on lending platforms and occupies half the volume of the top three lending platforms. Therefore, DAI's trading volume was able to maintain its level in April despite the drop in coin price, dominating the decentralized stablecoin market.


**Summary**
The crypto market is developing, and stablecoins are playing a greater role. Different uses and applications for various tokens are also becoming clear
USDT, despite compliance issues like its reserve shortfall, is still the most widely used stablecoin, used as a medium of transaction in centralized exchanges.
USDC, on the other hand, has gained a solid foothold in the DeFi world with its compliance. With the spurt of DeFi projects, USDC may soon surpass USDT and become the most popular stablecoin.
Other stablecoins, like DAI, can also see significant growth if they find their unique application scenarios.
# 3-First half of 2021: DEX shows strong growth as new contenders vie for lead position

Author: Footprint analyst, Simon in Aug 2021
As the performance of public chains improves, decentralized exchanges (DEXs) have continued to be crucial infrastructure for DeFi while demonstrating strong growth.
Automated Market Makers (AMM) allow users to exchange crypto assets without intermediaries.
As more competitors continue to emerge on the DEX racetrack, let’s take a closer look at data from Ethereum and Binance Smart Chain(BSC) to uncover macro trends from 4 perspectives.
### 1.Volume
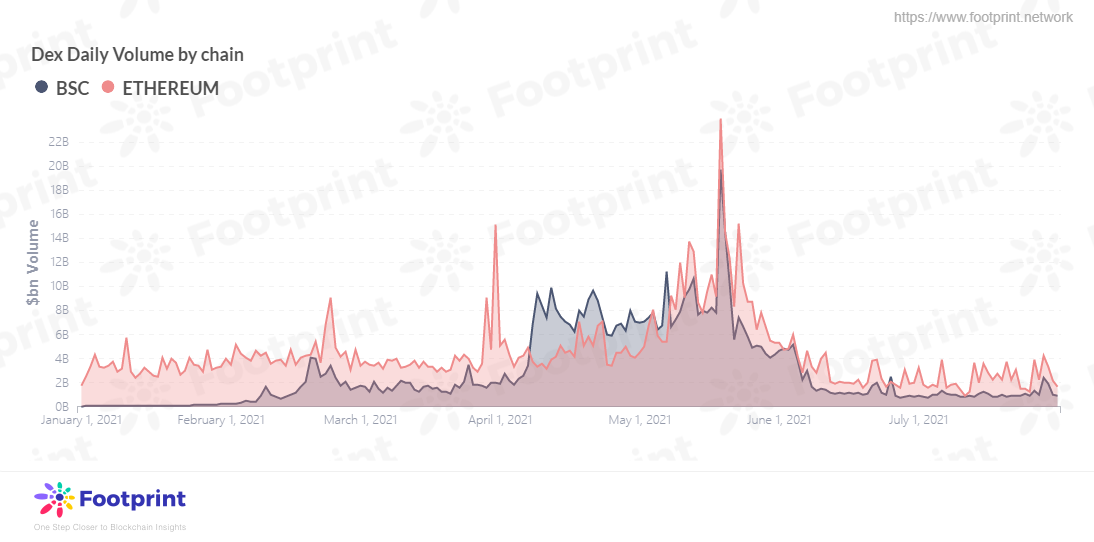
DEX has been the main application on Ethereum, and with the rise of DeFi, the trading volume of the DEX project also rose rapidly from March this year and doubled at the end of May.
The rapid growth also drew regulatory attention. As countries released their policies on blockchain one after another, some bearish voices also negatively affected DeFi, and the trading volume of DEX dropped rapidly after May. However, it still saw breakthrough growth compared to 2020.
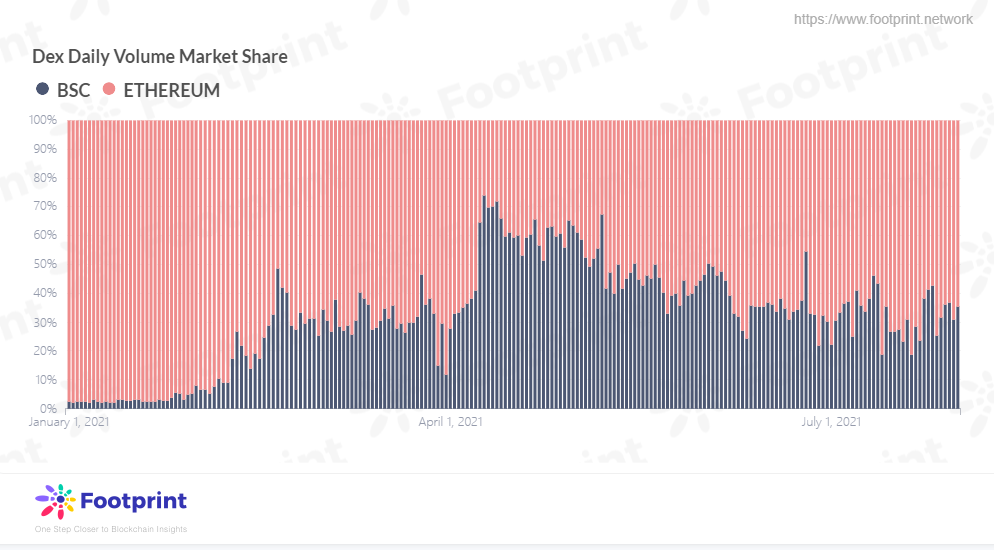
The rapid development of DeFi has increased congestion on Ethereum, causing higher gas fees. Now, BSC has been jockeying to catch up by using relatively low Gas fees. As observed from data on Footprint, in terms of transaction volume, BSC started to rise gradually from February this year and even surpassed Ethereum in market share in the second quarter.
However, Ethereum still dominates, with Uniswap V3 launching an Alpha version on the Optimistic Ethereum mainnet in July. Congestion also gradually improved as the Layer2 solution landed, and Ethereum regained market share in terms of volume.
On August 5, 2021, Ethereum EIP-1559 completed its hard fork upgrade, and the proposal contains many advantages benefits, including transaction fee destruction. We will wait to see whether it will further enhance Ethereum's market share.

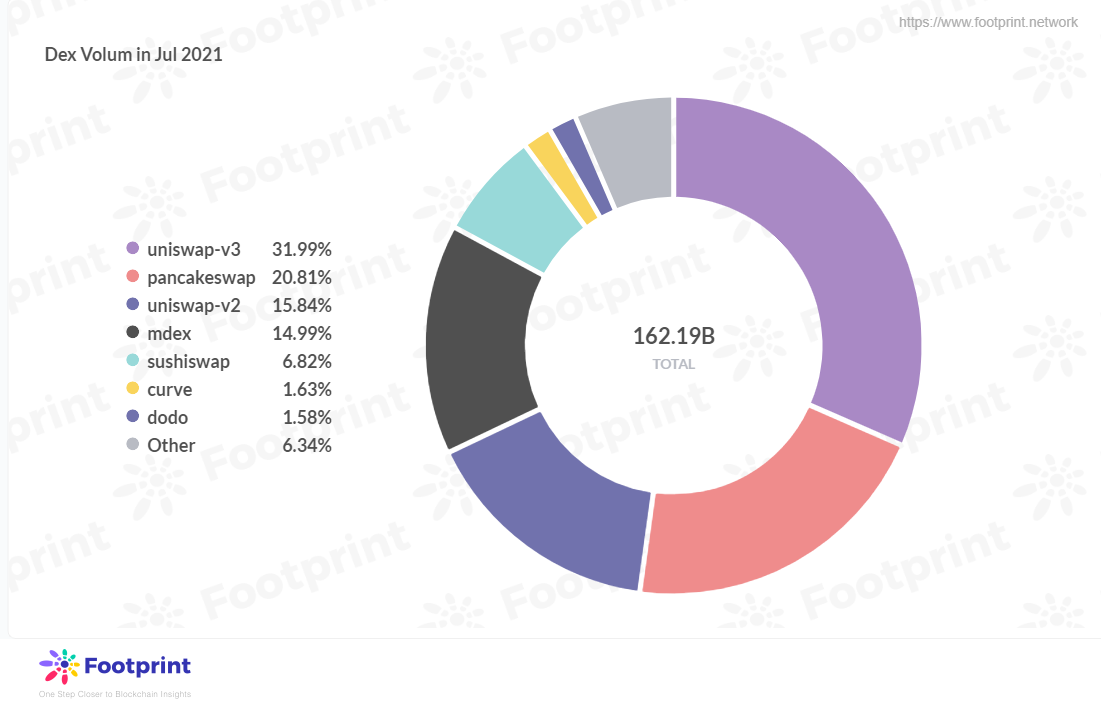
There are more DEX platforms on Ethereum, including Uniswap, Sushiswap, and Curve. Uniswap, which accounts for the highest percentage on Ethereum, takes up nearly 50% of the volume on both chains.
Footprint data shows the volume of Uniswap V3 is already more than twice that of V2, and the performance of V3 since its launch has been outstanding.
PancakeSwap and MDEX mainly dominate BSC. It is worth noting that PancakeSwap has become a strong rival of Uniswap in the development of the BSC and has been encroaching on the market share since February, reaching a peak in April.
However, Uniswap upgraded to V3, and BSC had a lot of problems after May. PancakeSwap's market share was squeezed again, and Uniswap's market share returned to 50%. While Sushiswap also introduced bentobox, the competition between Ethereum and BSC is still going strong.
It's still anybody's game.
### 2.Token Price
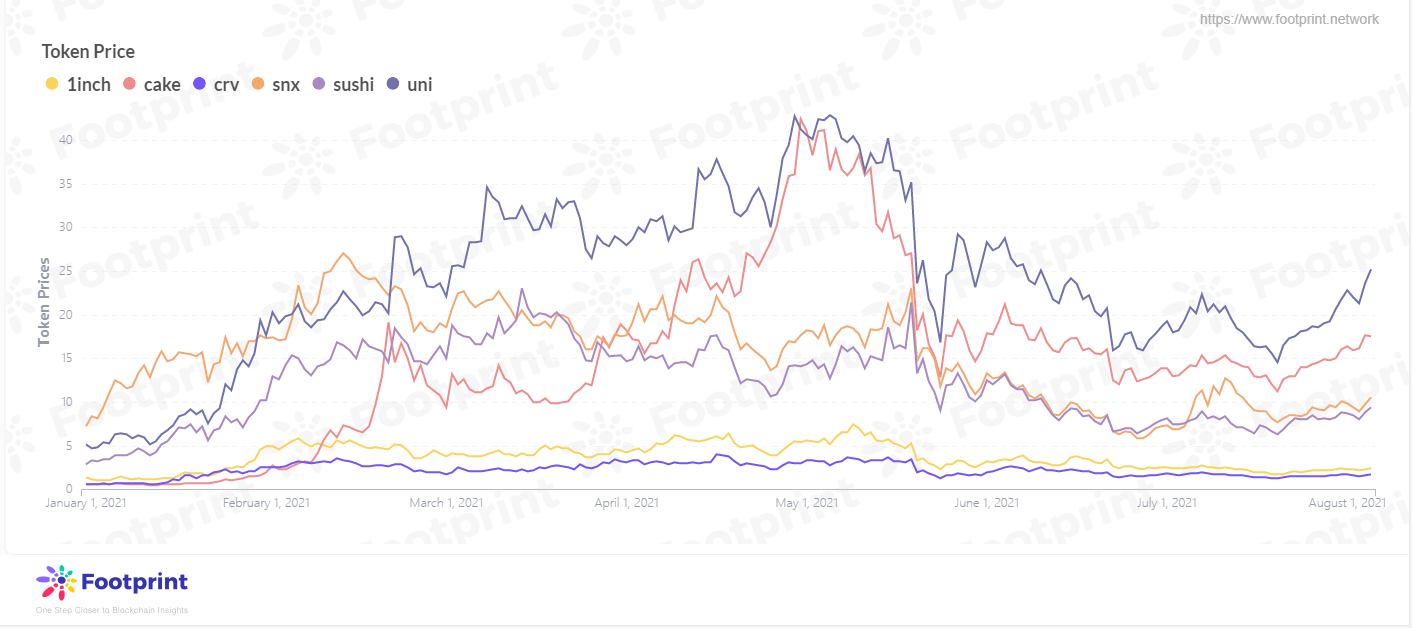
Data on Footprint shows that most DEX platform tokens kept an upward trend until May, among which PancakeSwap's token, Cake, rose most obviously. It even once caught up with UNI in May and reignited the strength of BSC, with both platform and chain achieving mutual success. Although the token prices of all platforms took a big dive after June, Uniswap and PancakeSwap, the head platforms of Ethereum and BSC, still led the pack.
Sushiswap as a DEX is often compared to Uniswap on the Ethereum, and while SUSHI holders can staking their tokens in exchange for xSUSHI and thus receive Sushiswap transaction fees, it is clear that the market is still more favorable to UNI in terms of token price.
### 3.Gas
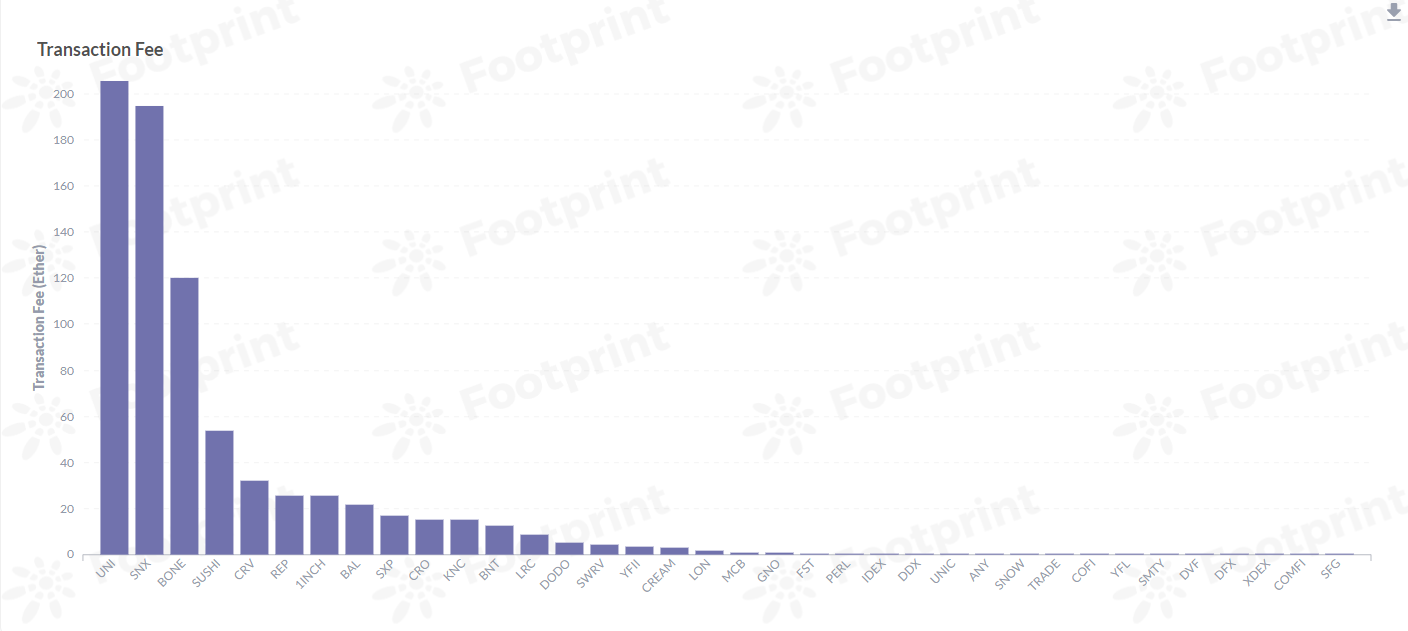
Any operation on the chain consumes a variable amount of Gas fees, depending mainly on the amount of work required for the process. Currently, contracts related to token exchange are among the contracts that consume the most blockchain resources, so DEX accounts for most of the on-chain Gas consumption.
The conversion to UNI generated the most fees of any token issued by Dex in the last month via Footprint statistics, further reflecting the market's bullishness on Uniswap.
### 4.Pairs
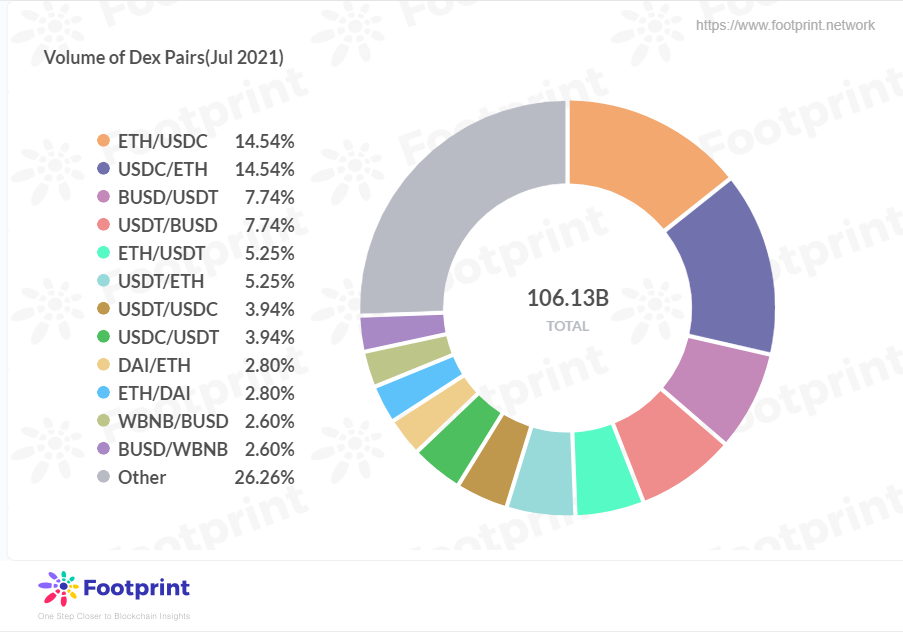
In July, the top 50 most traded pairs on the DEX platform were ETH/USDC, followed by USDC/ETH, which shows that the major pairs still revolve around stablecoins and ETH. Although various platforms have issued their own tokens, the market still recognizes stablecoins and ETH above all others.
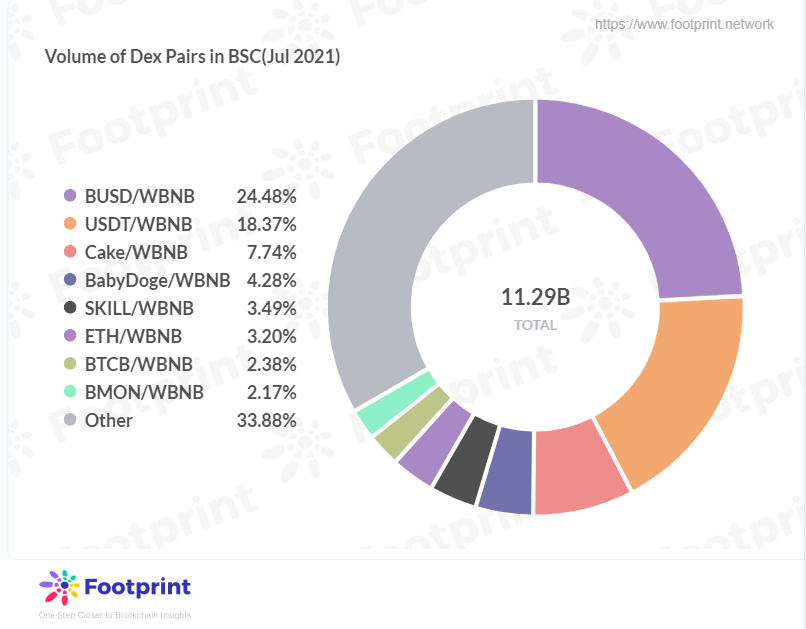
The main pairs on BSC are also stablecoins and WBNB, except for pairs anchored by WBNB. Cake has the highest percentage.
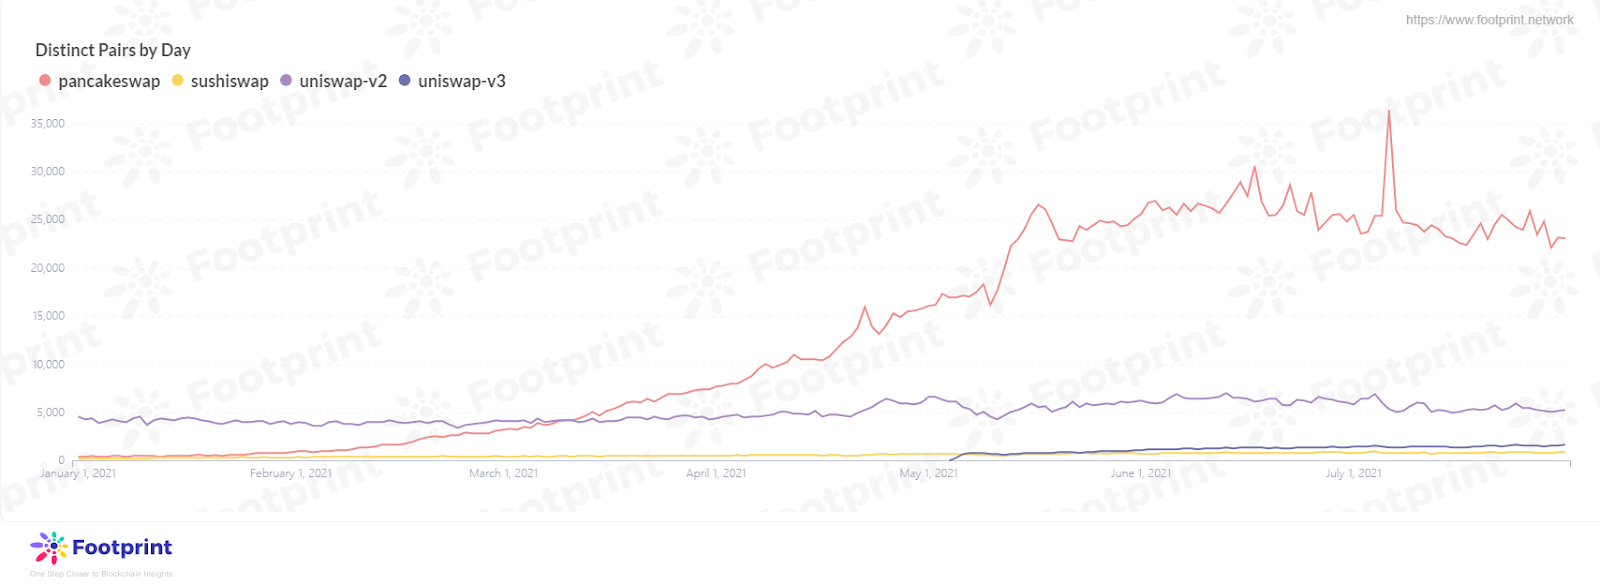
Regarding the distinct pairs with daily transactions, PancakeSwap overtook Uniswap in March this year and now has a daily number of over 20,000 pairs, while Uniswap's has remained stable Sushiswap's is at the bottom. PancakeSwap seems to be going places.
According to Footprint, the number of Sushiswap pairs with transactions in July was only 1,750, while Uniswap V2 has 16,534, Uniswap V3 has 3,386, and PancakeSwap has 135,278 pairs in July.
However, the SEC and CFTC have recently increased their scrutiny of exchange-traded tokens. In late July, Uniswap said it had decided [to restrict access to more than 100 tokens](https://github.com/Uniswap/uniswap-interface/blob/main/src/constants/tokenLists/unsupported.tokenlist.json) in light of the "evolving regulatory landscape."
**Summary**
Decentralized Exchanges(DEXs)grew rapidly in the first half of this year, even though regulations soon hit hard.
In light of this, Uniswap, Sushiswap and PancakeSwap led among DEXs, with SushiSwap in the first half of the crazy erosion of the market, he competition between Ethereum and BSC is continuing: BSC shows more advantageous Gas fee and the strong coming PancakeSwap, while Ethereum just upgraded to EIP-1559. Whether it can pull the lead in the second half of this year? We can expect this together.
# 4-ABCs of DeFi Data Analysis for Beginners.

Author: Jimmy\@Footprint, Aug 2021
It’s not for nothing that the summer of 2020 has been called the “DeFi summer”.
But since then, DeFi has only continued to grow. The Ethereum ecosystem saw enormous development, the number of wallets has grown to 3 million addresses and the daily TVL (Total value locked) reached $100 billion dollars.
What’s more, this TVL didn’t crash when the market prices of tokens fell in June.

At its most basic, decentralized finance is the opposite of centralized finance. Leveraging decentralization, transparency, standardization and security, DeFi promises to gradually bring traditional finance activities on the chain, transforming this industry.
In this article, we’ll use DeFi data taken from [Footprint](https://www.footprint.network/) (**which you can use for free by clicking here**) to illustrate some of the key terms and concepts in this space.
**DEX**

DEX, or decentralized exchange, is a peer-to-peer (p2p) online service that allows direct cryptocurrency transactions between two interested parties.
In the chart above, you can find the DEX volume of Q2 2021. This refers to the total amount of dollars that has been traded or held on the DEX. As you can see, the volume increased 80% over Q1 2021, and 1000x year-on-year. The volume of DEX has now reached 10% of centralized exchange volume and keeps increasing—July’s hitting 153 billion.
This indicates that DEX has become more and more popular among crypto investors . Someone who is just starting to explore DeFi and blockchain data with a tool like Footprint can therefore track DEX volume to find the leading players.

According to Footprint, data shows that Uniswap has become top DEX in market volume since the release of the Uniswap V3 protocol, which is designed to increase capital efficiency by increasing the capital efficiency by 4,000 times compared to V2. Uniswap V3 allows liquidity providers to set customized price ranges of market-making, for example to set bottom prices higher than current prices or vice versa.
It’s also important to know that there are also dozens of new or niche options as well. Since the world of cryptocurrency is notoriously volatile, an unheard of DEX today can easily grow to a major player next year.
Knowing that Uniswap V3 has the largest volume, you can be confident it will have less trading slippage—which refers to situations in which a market participant receives a different trade execution price than intended—and higher rewards for LP.
**Lending**

After exchanging the tokens needed through a DEX, investors can meet the requirements of depositing and borrowing through DeFi lending platforms. The TVL of the main lending platforms in Q2 2021 has increased over 4 times over Q1, and 25 times compared with Q2 last year. July’s TVL was 19 billion.

Among the lending platforms, Aave, which went public in 2020, has taken the lead position in terms of market share since June 2021. Aave offers “flash loans”, which allow users to borrow any available amount of assets without putting up any collateral, as long as the liquidity is returned to the protocol within one block transaction.
Compound, which launched in 2019, went in the other direction. Its flagship product is Compound Treasury, designed for non-crypto businesses and financial institutions.
Looking at the rate of outstanding loans divided by deposits of Aave and Compound, the capital efficiency of Aave increased significantly since May.
\
**Yield Aggregators**

Whereas traditional, centralized finance uses asset management, DeFi uses yield aggregators. Yield aggregators playing a key role in the yield farming economy by leveraging different DeFi protocols and strategies to maximize user profits. The yield farming process usually requires investors to lock up or stake funds, providing variable or fixed ROI in return.
Yield aggregators only hit the mainstream last June, but their TVL has already reached $5.69 billion in July. TVL of yield aggregators increased 130% from Q1 to Q2. Last month’s TVL was 5.69 billion.
Since yield aggregators have become a mainstay of DeFi investing, Yearn Finance has always led the pack. Yearn gained $18 million in revenue in Q2, which is 236% more than Q1.

The DeFi project has undoubtedly had its summer since last year, and this year the DeFi project has experienced some ups and downs, but it is still undeniably thriving. The changes the DeFi project can bring to our financial world in the future are even more worthy of our anticipation.
Footprint Website:
Discord:
Footprint is a powerful yet easy-to-use analytics tool to uncover and visualize blockchain data. The product puts user experience first—whether you’re an analyst, data scientist, developer, student, teacher, or executive. It provides an intuitive, drag-and-drop interface for interactive data queries.
# 5-Will on-chain data be used to predict the next DeFi explosion?

Footprint makes it easy for anyone to analyze and visualize billions of blockchain transactions—here’s why that might change crypto investing.
\
Blockchain technology has been a hot topic ever since the emergence of DeFi in 2017. The explosion of cryptocurrencies, and new trends like NFTs, has attracted institutions, investors, projects, investment institutions, traders and data analysts.
\
All are on the hunt to explore new DeFi applications. The potential for wealth creation is evident.
But, the growth of DeFi projects and users has also led to an explosion of on-chain data. The growing value of this largely untapped spring of information is perhaps the most significant trend underlying the industry's future.
**What’s the big deal about on-chain data?**
\
Blockchain provides many benefits for data analysis that traditional data does not. Here are three of the main features:
**1.A massive volume of high-quality data**
Once all blockchain data is verified and approved, these records become tamper-evident.With the rapid growth of users and businesses, the volume of data is becoming massive beyond what anyone could predict or foresee.
**2.Traceability and personalization**
Blockchain records include all the information necessary to track their origin and live text. This includes which address initiated the transaction when it occurred, the amount of the asset transferred the recipient address and transaction fees.
\
While all on-chain data is traceable, cross-chain and cross-platform data are more complicated since they include frameworks from different developers.
\
**3.Decentralization and anonymity**
Traditional institutions often can’t access comprehensive and accurate information about users because their private data is protected.
\
With the decentralized, anonymous property of blockchain, every transaction datum is public, taking the limits off data mining and analysis.
**Challenges for Effective On-Chain Analysis**
Blockchain is still a new technology. It’s fair to say that we are just beginning to understand and explore the value of the data it provides.
At this early stage, being able to collect, summarize and visualize data effectively is critical. Currently, most blockchain analytics tools focus on cryptocurrency quotes and compliance analysis.
\
**Why?**
Up to now, several roadblocks hinder creating powerful, easy-to-use analytics platforms for blockchain.
**1.Difficult to process data**
On-chain data is multi-platform, multi-chain, and multi-project. The first step of creating meaningful insights is to consolidate this massive amount—which includes processing each data source one by one to schematize data formats, highlight key events and understand the business logic.
Naturally, the access speed to do this task is plodding.
**2.Hard to import incremental data**
Different platforms and projects don’t always support users importing outside data for analysis. Users cannot combine data and events to discover macro trends.
**3.Platforms are incomplete**
The range of tokens, assets and DEXs available on platforms is limited, usually missing non-mainstream currencies, NFTs, and other highly relevant projects. Platforms also lack historical data, user behavior dimensions, and other vital events analysis capabilities.
**4.Lack of data applications**
Many analysis tools can help users find data, but they cannot help users apply it in ways that can answer their real-world questions. Particularly, attempts at data visualization fall short.
Most of the visualizations are single view charts showing particular blockchain measures over time. These single disconnected views make it challenging to relate multiple blockchain characteristics to each other.
**5.Poor analysis experiences**
Users generally have two options for selecting an analytics dashboard.
First, they can choose platforms that provide ready-made dashboards, severely limiting the type of data and analysis.
Second, they can select custom dashboards to import, fork and merge data tables. The problem lies in the fact that these tools are not beginner-friendly at all. They require coding and knowledge of SQL.
In other words, the threshold of operation is high. A custom analysis is essentially impossible for the many DeFi investors and enthusiasts who do not have these technical skills.
**6.Difficult to track address data**
Tracking the address behavior of centralized exchange wallets is not easy, especially when dealing with multi-wallet addresses.
As a result, current platforms cannot integrate multi-chain data for the same wallet and cannot track wallet behavior over time. This gives their visual charts a static quality which fails to capture transactions and movement as they happen in reality.
**7.Few tagging applications**
Tags make parsing through different tables, metrics, and dimensions efficient. However, there is a notable lack of tags based on behavior categories, business connotations, analysis scenarios, and other useful categories in the current data platform offerings.
Most platforms do not support custom tags—something that is a prerequisite in other industries dealing with data. Those that do support custom tags still lack tagging rules, which are guidelines for users to give definitions to the tags.
**Footprint makes blockchain analytics possible for anyone**
Many blockchain-focused data analytics platforms have stepped in to make blockchain data accessible.
As the demand for blockchain analytics grows, these tools are becoming more effective and powerful, each serving the needs of different kinds of investors and businesses.
Footprint is one such platform. Built by a team of internet serial entrepreneurs, it is a one-stop analytics platform that helps you visualize your blockchain data exploration results with an effortless, easy-to-use, and user-friendly interface.
Footprint offers the following solutions for data analytics users.
**No coding or technical skills required**
Footprint solves the problem of exploring blockchain data and gives users an effortless drag-and-drop experience. There is no need for SQL queries or coding to analyze blockchain data—anyone can discover and present actionable DeFi insights with the sleek interface.

**Fork queries with one click**
Footprint provides rich data analytics templates that support forks with any open analytics table on the platform with one click, helping users easily create and manage personalized dashboards. Users can also share data tables and dashboards with partners or on social media.

**Supports cross-chain data**
Subscribers get a platform that provides cross-chain and multi-project type data, supporting users to draw and analyze data charts by chain and project type.

**Advanced wallet labeling**
The Footprint database has generated tags by category for the DeFi platform. And now it supports users to tag reports and dashboards, so users can quickly search for the report templates they need based on the tags.
Underlying the usability of the platform are advanced wallet labeling capabilities. It tracks and labels every individual wallet address exchange, meaning users can see which addresses are accumulating or selling off specific tokens, plus their portfolio profits. This enables both hyper-targeted research and uncovering macro DeFi market trends. With token metrics for usage, engagement, and liquidity, users can make informed decisions before and after investing.

**Community-powered by DAO**
\
To push the possibilities of decentralization while building a supportive community, Footprint’s DAO brings together active, diverse and engaged members to inspire and support one another through forums. The decentralized organizational structure of the Footprint community allows its users to share insights and actively drive development.

**Where will blockchain analytics take you?**
Cryptocurrency transactions involving multiple chains, projects, and wallets are an enormous challenge for developers and data analysts because of the data volume and complexity.
For data analysis platforms, collecting and organizing standardized data structures takes a lot of time and effort and requires constant investment in long-term maintenance. Because of the complexity of the data, most of the analytics tools on the market only realize the overall statistics or part of the chain's data, and there are almost no platforms that can provide microscopic data granularity that can be tracked to individual behaviors like Footprint.
With the development of the multi-chain ecosystem, data analysis will usher in development opportunities like never before.
As an early innovator in accessible analytics tools, Footprint will likely support the growing interest in DeFi with its pleasant, simple interface experience and powerful data capabilities.
To learn more about Footprint, join the Discord community: or check the below website: .\
\
\
\
# 6-Who benefits from EIP-1559?
_%E6%9E%81%E9%80%9F%E7%9C%8B%E5%9B%BE.jpg?alt=media\&token=d5c81507-32dc-4546-b1b8-f74068647058)
Sep, 2021,
On August 5, 2021, the eleventh hard fork, Ethereum London, upgrade was activated at block number 12,965,000, marking one of the most important events for the chain in recent years. The first block of the upgrade burned 0.030025257 Ether, making it a historic moment.

The London upgrade includes five EIPs (Ethereum Improvement Proposals), namely EIP-1559, EIP-3198, EIP-3529, EIP-3541 and EIP-3554, of which the most attention has been focused on EIP-1559, which makes a revolutionary change to the transaction fee system of Ethereum.
Although EIP-1559 was proposed back in April 2019, it did not finally land until the London upgrade in 2021, mainly due to the different parties' interests.
**Before the upgrade:**
Transactions on Ethereum adopt an auction model. Due to the asymmetry of information, users cannot predict how much they need to pay to have their transactions processed immediately, so they may pay higher transaction fees. While miners, whose revenue comes from the Gas fees paid in user transactions as well as block reward and uncles reward, tend to give priority to transactions that pay higher Gas fees.
When Ethereum becomes congested, the Gas fee paid by users rises even higher. With the continuous development of the protocol, the high and volatile Gas fees on Ethereum and inefficiency of transactions discouraged many users, who turned to other protocols like BSC.
**After the upgrade:**
EIP-1559 essentially seeks to optimize the pre-upgrade issues in two ways:
1. Fee allocation mechanism
EIP-1559 divides the previous lump transaction fee to miners (also known as Gas Fee) into two parts:
* Base fee (aka Burnt fee)\
The base fee is calculated based on both the base fee of the previous block and the block utilization, and is a must-paid fee that users cannot adjust. When the utilization of the previous block is higher than 50%, the base fee will rise; on the contrary, the fee will fall. This part of the fee has introduced a controversial mechanism called the burnt mechanism, which will change the currency policy of ETH.
* Priority fee\
Paid optionally by the user, the fee is paid directly to the miner, and the same high amount can be set to attract miners for users who want to speed up transactions. However, when trading peaks, the act of facilitating transactions by constantly increasing the priority fee seems to return to the pre-upgrade auction model, only with a more predictable base fee after the upgrade.
1. Slack mechanism of blocks
In the face of a sudden surge in demand for transactions, EIP-1559 allows for variable block sizes, a target Gas usage of 50% of the top line of Gas, and a base fee that rises when it rises, these mechanisms allow for smoother Gas prices.
**Who benefits from the EIP-1559 upgrade?**
EIP-1559 has received a lot of discussion since its launch, and Ethereum has gained unprecedented attention as a result. For this upgrade, there are a lot of voices from all sides and various analyses.
Below is a detailed analysis of the performance in terms of Ethereum Gas fees after the London upgrade, using data from [Footprint](https://www.footprint.network/dashboard/160?date=past6months~) (you can find detailed data by clicking here).

Before the upgrade, many said that Gas fees would decrease. But, according to Footprint data, the daily total Gas fee paid by users after the upgrade is about 5600 ETH, and the base fee burned is about 4,100 ETH, which is not significantly lower than the 2 months before the upgrade. Rather, it indicates a slight upward trend, and the base fee is instead closer to the pre-upgrade Gas fee, but users have to pay an additional priority fee on top of that.

From the Footprint data, the uptrend of average Gas price and base fee per Gas after upgrade implies that the number of transactions is not the only factor affecting the total transaction fee.
Therefore, from the current data, EIP-1559 does not make the Gas fee lower, but rather increases it. If the ETH price rises, the actual fee paid by users will further increase, but the change of Gas fee after the upgrade does seem to have stabilized.

Although the Gas fee is not significantly lower, it seems from the data that users can try to avoid peak hours. Generally, 19:00 (UTC+0) is peak transaction time, with the price at its highest point.
For users, all the data indicates that there is no reduction in transaction fees.
**How does that affect miners?**

After the upgrade, the only revenue miners will receive directly from users, in addition to the rewards given by the blocks, will be the priority fee.
Although the priority fee represents a small portion of the total transaction fees paid by users, data from Footprint shows that the total daily miners' earnings are not much lower compared to the total earnings before the upgrade. As of August 23rd, the average gas fee was 0.94ETH per block, of which 0.69ETH of the base fee was burned. Miners will receive 0.25ETH of the priority fee.

In the view of the ratio of base fee and priority fee, about 20% of the current transaction fees are paid to miners by users as priority fee, which also means that 80% of each transaction will be burned.
At the time of writing, about 77,268 ETH have been burned, and an average of 3.96ETH will be burned every minute for nearly 24 hours. Such an amazing amount of ETH burn in less than a month is bound to curb ETH inflation to a certain extent, thus stimulating the ETH's price to rise. It is worth noting that the top three projects that have burned the most base fees are OpenSea, Uniswap and Axie Infinity, in that order.

In the end, let's view the current token price of ETH, as of press day the price is $3,217, currently looking at the overall trend from the upgrade is still up, combined with the above data to see that the daily priority fee for miners has not fallen more significantly, miners' earnings in the long run will not necessarily be affected. For the hodlers of ETH, the result is positive, but from the user's point of view, not so much. The upgrade does not look to have successfully reduced transaction fees, but a slight increase, coupled with the burned scheme makes the ETH token price rise—a double burden for users using Ethereum.\
\
Footprint Website:
Discord:\
Footprint is a powerful yet easy-to-use analytics tool to uncover and visualize blockchain data. The product puts user experience first—whether you’re an analyst, data scientist, developer, student, teacher, or executive. It provides an intuitive, drag-and-drop interface for interactive data queries.
# 7-What’s so special about Solana?

Sep, 2021,
\
You’ve probably heard of Solana, a blockchain that is attracting more and more projects and users with its rich and diverse ecosystem. For one thing, Solana's token, SOL, surpassed $112, up 208.9% from the beginning of the month, and continued to rise in September, becoming the number 3 coin in terms of market cap.
Then, Audius, the decentralised streaming service launched on the Solana, established a partnership with TikTok. This partnership has attracted a large number of users to the project and to the chain.
In this article, we analyze why Solana is able to shine among the dozens of blockchains out there.

#### **Solana has formed a sophisticated ecosystem**
Unlike other blockchains, Solana's development strategy is to improve its technology and consolidate its infrastructure first, before proceeding to focus on aggressively growing the number of projects and users, or ecosystem.
Therefore, Solana attracts engineers with strong technical backgrounds such as Qualcomm and Intel to provide it with strong technical talent support.
\
Solana also tackles the triangle problem of blockchain—which refers to creating blockchains that are decentralized, secure and high performance—through a handful of innovative technologies. These include Sealevel, which enables parallel smart contracts, Cloudbreak, a horizontally scalable account database, and Archives, a distributed ledger storage system.
With the great explosion of the ecosystem, the chain has gone from rarely used to gradually forming 332 projects in 24 major fields such as DeFi, tools, infrastructure, NFT, gaming, wallets, DApp, and developer tools.
\
**Solana transactions are cheap and fast**
To solve the problem of chain transaction congestion and high transaction fees, Solana uses the PoH (Proof of History) mechanism, which is different from other blockchains. By allowing each node to generate a local timestamp, data updates and data state processing do not have to wait for the entire blockchain network to synchronise. This ensures shorter times for transaction validation, thus improving transaction processing efficiency and security.
The PoH mechanism can process up to 65,000 transactions in 1 second, which is much higher than the 100 transactions per second of the Binance Smart Chain and the 15 transactions per second of Ethereum. With the improved processing efficiency and reduced energy consumption, the average transaction cost of Solana is $0.00025 per transaction, which is about 80,000 times less than the $20 per transaction of Ethereum. The low transaction fees and efficient transaction speed of Solana not only lower the transaction threshold for participating DeFi users, but also attract more users and project parties to go live and trade on the public chain.

#### **Solana’s TVL has exploded, ranking 5th among blockchains**
From a TVL perspective, while Ethereum still maintains its leading position and holds a large percentage of the market share, Solana's growth rate is arguably one of the highest when looking at the rates of each public chain. Solana was pulled into the spotlight again at the beginning of June with the news that it had received $314 million in funding led by a16z and Polychain.
In just three months, Solana's TVL has increased by 232%, occupying 1.8% of the market share. The most outstanding month was August, with an increase of 138.8%, surpassing the Huobi ECO Chain (Heco) and temporarily ranking fifth in the public chain.

**Solana is becoming a go-to for DeFi and DEX projects**
As the Solana ecosystem explodes, all sectors are contributing to the chain's TVL growth. Among the various categories of applications, the most prominent are DEXs, which dominate DeFi applications with a high share of 78.4%.
Several DEXs that have built on Solana recently are lending project Mango Markets in April, yield platform Solfarm in May, Parrot Protocol in June for minting and Marinade in August for staking.

#### **DEX platforms that use Solana are growing**
Looking at the development of the DEX platforms in Solana, the pace of growth has been very rapid since June. In less than 3 months, the number of DEX platforms online has risen from 3 to 6, and the TVL has increased from $830 million to $2.61 billion, an increase of 214.5%. Raydium, the first DEX platform on Solana to use the AMM mechanism, continues to be the leader, creating liquidity for the entire Solana ecosystem and gradually expanding its TVL advantage. With a growth rate of 425%, Saber overtook Serum for second place in August and is set to become a strong contender to Raydium.

It is important to note that DEX platforms developed on Ethereum still have the most TVL in the industry by far. However, thanks to Raydium, Solana DEXs have now cracked the tiop 10 with its $1.1 billion TVL**.**
\
**Summary**
Solana’s bet on leading with its technology first has finally appeared to pay off, with investors are bullish and the ecosystem gradually becoming optimized. At Footprint Analytics, we've created a [dashboard](https://www.footprint.network/guest/dashboard/e22e8f10-57e5-4ce8-bb34-aa8d1c65bbe1#secret=D4A5B4D23807B960B7BEA23282375D57) on Solana for readers to keep track of its development.
After our analysis, we believe Solana will continue to carry all the major DeFi applications that rely on this public chain and continue to provide value with its distinctive and innovative technology.
Footprint Website:
Discord:
Twitter:
**What is Footprint Analytics**
Footprint Analytics is a powerful yet easy-to-use analytics tool to uncover and visualize blockchain data. The product puts user experience first—whether you’re an analyst, data scientist, developer, student, teacher, or executive. It provides an intuitive, drag-and-drop interface for interactive data queries.
# 8-Avalanche gains momentum as blockchains battle breaking out

Sep, 2021,
**All chains see unprecedented growth**
It looks to be another blockchain summer.
\
New chains are cropping up and concepts like GameFi, NFTFi and SocialFi are gradually emerging.
Besides Ethereum and Binance Smart Chain (BSC), some emerging chains such as Polygon, Terra, Avalanche, and Fantom are also gaining prominence and attracting attention.
In this article, we take a closer look at the DeFi data of each chain on [Footprint Analytics](https://www.footprint.network/guest/dashboard/35dfdf0f-5c59-4504-9907-7374eae92981#secret=727B0EE190659200095FB5F4868DD0EB).

Since the blockchain crash in May, DeFi has experienced a brief period of depression.TVL data from Footprint Analytics shows that the top 10 chains recovered to their May peaks in mid-August after a stagnant three months. Of course, Ethereum leads the other chains and continues to gain momentum, with 140.5 billion in TVL as of September 13.

Ethereum occupies about 75% of the TVL of all chains, with the remaining 25% divided primarily between BSC, which comes second with about 10% of the TVL, followed by Terra with 4% and Polygon with about 3%.
Polygon is highly regarded as the native Layer2 of Ethereum, enabling Aave, Curve, Sushiswap and other head protocols on Ethereum to be easily transferred over. Polygon has some important advantages over the congestion and high Gas fees on Ethereum.

Polygon had its big breakout in May, riding on the momentum of Ethereum. TVL rocketed to 5025% in less than six months since Polygon announced the launch of its $100 million DeFi fund in April.

According to the number of protocols by blockchains included on Footprint Analytics, Ethereum has 276 protocols, 3.14 times more than second place BSC, followed by Polygon, Fanton, and Avalanche.This second echelon of blockchains should not be underestimated in the future.
The main vertical for blockchains is decentralized exchange, being the category with the most protocols, followed by yield farming and lending.
In August, a financial inclusion program called "DeFi for the People" was announced, with head DeFi protocols such as Aave, Curve and SushiSwap.

Among the top 30 protocols by TVL, 18 of them are on Ethereum, including Aave in first place. Then comes Polygon, followed by InstaDApp, Curve, and Compound. BSC has eight protocols in the top 30, with PancakeSwap ranking first with a TVL of 5.97 million, followed by Venus with only half the TVL. Terra is ranked third with four protocols, led by Anchor in the Lending category on this blockchain, followed by Lido and Mirror, which are also deployed on Ethereum.


The token price of each blockchain reflects how the blockchain is valued by users and also affects the cost of user transactions. Also the token price is affected by the volume in the exchange market. It is clear from the Footprint Analytics data that ETH is way ahead of other tokens, currently at $3941 of which price level is decided by the adoption of its ecosystem as well as its recent upgrade from POW to POS and the EIP 1559.
From the above chart of Token Volume, we can see the increasing growth of SOL since August from historical average $40 to the highest level of $160. Same with the AVAX. The increasing trading volume of these tokens is caused by the stronger demand for higher speed and better efficiency, especially when NFT and more protocols were introduced.
On the contrary, Polygon's token MATIC is currently only $1.68, and as a side chain of Ethereum, the transaction fee consumed by users in Polygon can be said to be worlds apart compared to Ethereum.\
**Avalanche gaining momentum, AVAX leaps to fourth place**
BSC began to explode in February of this year. Three months later in May, Polygon also began to grow at a high rate. In August, Avalanche skyrocketed.The fastest growth rate of each blockchain since Q2, except for Polygon, is Solana and Avalanche, with 1,497% and 1,124%, respectively. Solana has been researched in detail in the previous analysis (details can be found at this link).

Avalanche saw spectacular growth in August 19, which is inextricably linked to the updated Ethereum cross-chain bridge and Avalanche's liquidity mining reward program. On August 18, the Avalanche Foundation announced the launch of its $180 million liquidity mining incentive program, Avalanche Rush, and the following day the Lending protocol Benqi went live, joining forces with the Avalanche Foundation to launch a $3 million 90-day liquidity mining incentive program that allows users to receive both AVAX and Benqi when they borrow on the tokens Qi. It took only 4 days for the TVL to exceed 1 billion, making it the largest TVL protocol on Avalanche.

Compared to the 66 protocols with TVLs over 100 million on Ethereum, Avalanche has only 4, leaving a lot of room for growth. In addition to Benqi, who benefits from the Avalanche Foundation's incentive program, Trader Joe and Pangolin in the Dex category, and Yield Yak in the Yield category, ranked next.


Pangolin was the first Dex on Avalanche, and after it went live in February, it was still the largest Dex protocol at the time, although it happened to be affected by the explosion of the BSC at that time, and it remained lukewarm until August. Trader Joe protocol started to take off in August, gradually overtaking Pangolin and now leaping to number one in TVL of Dex.

Avalanche's liquidity mining reward program also mentions that it will receive AVAX, excluding ETH and BNB, and compared to other second echelon tokens, AVAX currently has the second highest token price at $47, up 167% from $28 on August 18.
We believe that with the introduction of Aave and Curve in the near future, two highest TVL protocols on Ethereum, Avalanche will gain its next momentum.
With the TVL of Avalanche and tokens on the chain have grown enormously, it’s easy to lose sight of the underlying strengths, namely security. Ethereum's Proof of Work has undergone a longer period of validation, while others with Proof of Stake are new and still need time to be verified.
The premiums of the various blockchains that are currently blossoming are being pushed up continuously, but when the reward programs, whether it will be a mess or continue to thrive, needs to be evaluated more carefully by users.
Footprint Website:
Discord:
Twitter:
**What is Footprint**
Footprint is a powerful yet easy-to-use analytics tool to uncover and visualize blockchain data. The product puts user experience first—whether you’re an analyst, data scientist, developer, student, teacher, or executive. It provides an intuitive, drag-and-drop interface for interactive data queries.
# 9-Will Terra crack the Top 3 in Q4?

Oct, 2021,
In the last quarter, several blockchains have blossomed in the bull market, overtaking older projects.Polygon, which emerged in May, has seen a lack of growth after three months, and its TVL has dropped. Meanwhile, Terra and Solana have overtaken Polygon in mid-August and early September respectively, and Avalanche is also gaining momentum, with a trend of overtaking Polygon. Polygon was the third largest TVL public chain after Ethereum and BSC, and may drop to 6th place. Footprint Analytics already conducted an in-depth analysis of Solana and Avalanche (details can be found at this link), and this time we will continue to use DeFi data from Footprint Analytics to take a look at Terra.

**Focus on finance and Connect off-chain data**
Terra launched in January 2018 and the main network in April 2019, behind the operation of Terraform Labs, based in Seoul, South Korea. Terra has 3 funding rounds from 2018 to 2021, with a cumulative funding of over $200 million. The most recent funding was $150 million on July 16, 2021, which was primarily used to fund the construction of ecosystem projects on the Terra.
The most obvious feature that distinguishes Terra from other blockchains is its founding team's extensive business background and resources. Its two payment programs, CHAI and MemePay, have opened up offline payment scenarios in Korea and Mongolia respectively. This makes Terra a “real” blockchain that can be linked to real life.
Unlike other blockchains that have only one blockchain token, Terra has both Luna and its native stablecoin UST, anchored to USD, as well as the stablecoin KRT, anchored to South Korean won, and the stablecoin MNT, anchored to Mongolian Tugrik, and the stablecoin SDT, anchored in the International Monetary Fund's Special Drawing Rights SDR.
**Double-token model, UST ranks 4th in market cap among stablecoins**
Terra Chain uses a double token model, with Luna, a token mainly used for governance, staking and verification, and UST, a native stablecoin anchored to the USD. UST is backed by Luna, and for every UST minted, one dollar worth of Luna must be burned, and Luna maintains the anchoring of UST to the USD through an arbitrage mechanism.
Compared to other blockchains with numerous protocols in the ecosystem, the entire Terra protocol is set up around its original stablecoin UST. The protocol on Terra comes with its own UST transaction context since its inception, and the UST can be connected to offline payments.

As seen through Footprint Analytics, UST has the fourth highest market cap among the common stablecoins on the market currently ($2.673 billion). The first and second ranked USDT and USTC are centralized stablecoins, and the third ranked Dai can't be considered a completely decentralized stablecoin, and the decentralized stablecoin UST can be considered the top. This is inextricably linked to Terra's access to offline platforms, which is the most "useful" stablecoin compared to other stablecoins. It has loaded the "illusory" blockchain world with real usage scenarios, which is also reflected in its own market capital.
**Luna grows 416% in four months, jumps to Top 5 in blockchain tokens**
Luna is the PoS token for Terra, meaning the higher the price of Luna, the more secure Terra will be. The demand for Terra stablecoin UST, which is generated from miners pledging LUNA, is not only in Terra, but also in other blockchains, so the application of UST in other blockchains is actually an expansion of the value of LUNA to other blockchains. While for other blockchains, the value of their native tokens is only gained through the amount of transactions and cannot be captured beyond.
Since Terra launched its main network in April this year, Luna had a small rise, and after falling after the "519" token price plunge incident, it gradually pulled up again in July and rose sharply in August, from $6.55 at the beginning of June. Overall, it has risen about 416%. But from the data of Footprint Analytics, we can see that Luna now has the fifth highest price among blockchain tokens. Though its price is half of the 4th place AVAX, its trading volume has been comparable with AVAX, and even far more than MATIC. Clearly, this kind of blockchain, which connects online and offline, sees a lot of transaction volume.


Nevertheless, given that UST is anchored by $1 Luna as a stablecoin, volatility in Luna’s price will also cause UST to break away from the $1 anchor. However, many analysts believe that the stability of the blockchain will be gradually strengthened as the number of Terra users and transactions gradually increase.
**Ecosystem tightens around stablecoins, Mirror tokens most actively traded**
Compared to other blockchains with extensive ecosystem protocols, Terra seems to be much more "streamlined", with its ecosystem protocols being tightly focused on UST, with Mirror (synthetic asset protocol) and Anchor (fixed APY savings protocol) being designed to create immediate use cases and demand for its stablecoin.

The TVL of each protocol on Terra from Footprint Analytics shows Anchor, Lido, Mirror, and Terraswap currently make up about 95% of the project’s TVL. This nearly catches up with Solana's TVL, but Terra's growth has been steadier than Solana's, which has been explosive
Anchor is the head protocol on Terra and currently has a TVL of $3.08 billion. Anchor is a savings protocol that offers a fixed APY, similar to a bank, where Anchor will lend out deposits but requires the borrower to provide assets as a stake.
Mirror is similar to Synthetix as a synthetic asset protocol, but Mirror's current TVL in Terra and Ethereum is already comparable to Synthetix. Mirror currently covers a variety of synthetic assets such as US stocks, BTC and ETH. It provides a powerful application scenario for UST, and will also increase miners' income and make Terra's system grow towards more stability.

From the volume of each protocol token, Mirror's token, MIR, has the highest volume in the last 90 days, although its token price is only $2.81 as of Oct 13,2021, it can be seen that its volume is relatively active compared to other protocols on Terra. This is inextricably linked to Terra's efforts to bring cryptocurrencies into the real world, and Mirror is now an industry leader in synthetic US stock trading.
**Summary**
Terra is a distant match to the recently surging SOL and AVAX in terms of token price, but its steadily growing TVL nearly surpasses Solana again. Terra also upgraded Columbus-5 on September 30 at block height 4460000. Whether Terra can surpass Solana after this upgrade is worthy of our expectation.
Terra stands out from other blockchains because it comes with its original stablecoin, UST, and its protocol has been developed closely around UST. Compared with centralized stablecoins, UST is more centralized and there is reason to believe that in the future UST can be comparable to DAI. Terra is also connected to the Korean and Mongolian markets through CHAI and MemePay, linking the "virtual" with the real world. This organic combination of on-chain and off-chain is the key driver for Terra to catch up with other blockchains.
Footprint Website:
Discord:;
Twitter:
**What is Footprint Footprint**
Analytics is an all-in-one analysis platform to visualize blockchain data and discover insights. It cleans and integrates on-chain data so users of any experience level can quickly start researching tokens, projects and protocols. With over a thousand dashboard templates plus a drag-and-drop interface, anyone can build their own customized charts in minutes. Uncover blockchain data and invest smarter with Footprint.
# 1-Footprint Industry Overview: July 2021 DeFi market recovering, can we have confidence in August?

Author: \
Date: 8 August 2021
June was a rocky month for DeFi, coming off a fall in token prices in May, a drop in TVL and low user activity across all types of platforms.
Although this is not the first time we have seen a significant drop in token prices, uncertainty in the market has lowered expectations for users involved in DeFi, with more uncertainty about when the market will recover to the levels seen in May.
Footprint's July monthly report looks at multiple metrics to assess and anticipate trends for August.
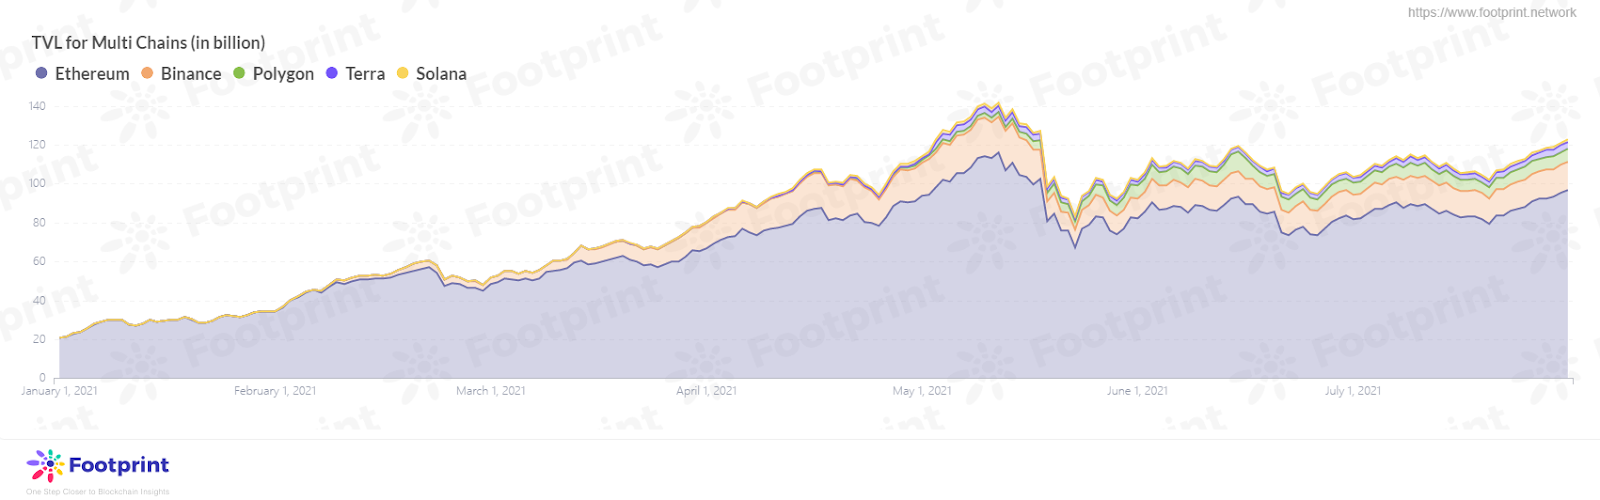
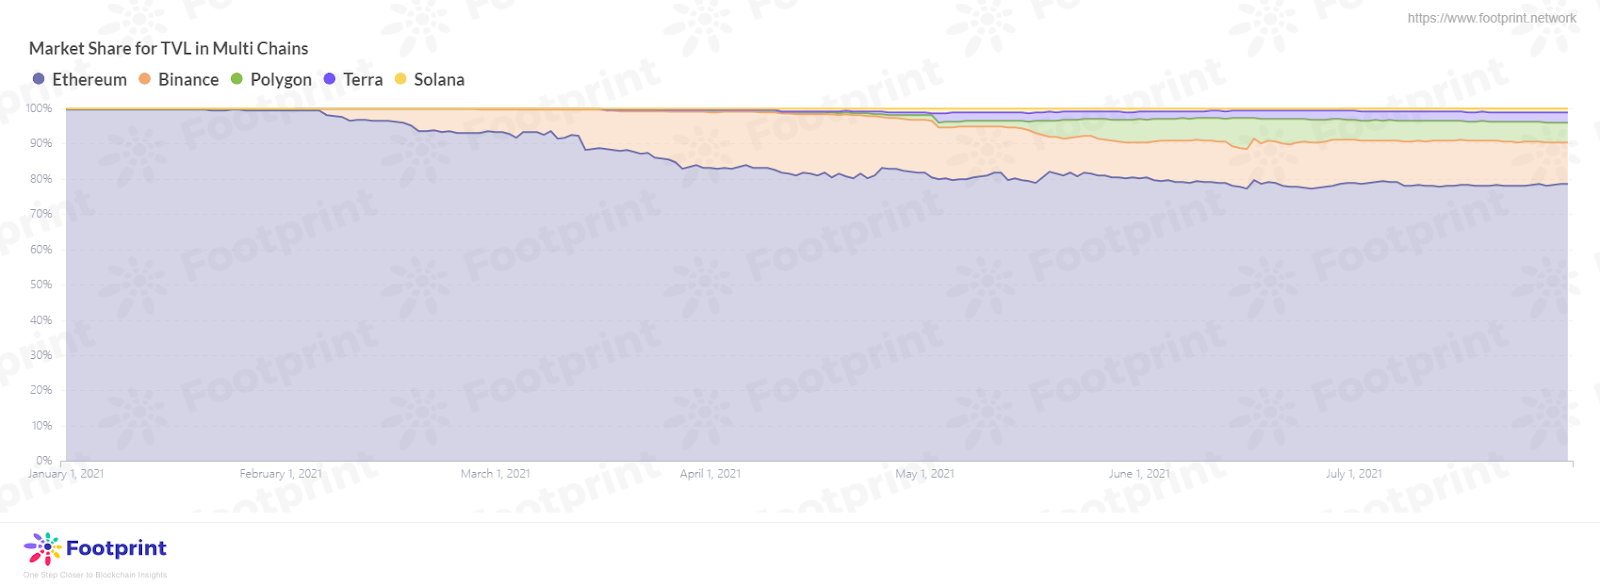
**TVL on multiple chains trending upwards, Polygon and Terra have recovered to May levels**
According to data provided by Footprint, the TVL of major five blockchains,i.e. Ethereum, Binance Smart Chian(BSC), Polygon, Terra, Solana, in July was $123 billion. Ethereum occupied the top spot with $96.83 billion, accounting for 78.7% of the market share, continuing its dominant position. In July, Ethereum achieved a growth rate of 15.8%, although the growth rate did not show outstanding performance compared to other chains. However, from the current growth rate, it is expected that the TVL of the Ethereum in mid-August will exceed the level of May and reach a new high; while the TVL of the BSC Compared to June, it has increased by 10.73% to reach $14.55 billion. Nevertheless, it has still maintained a stable level, and it will be difficult for the BSC to return to May peak levels in August.
The more impressive performers in July were the Polygon, Terra and Solana chains, with Solana's improved TVL on the Raydium platform giving it a growth rate of 135.6% and a market share of 1.1% from 0.6%; Polygon and Terra have surpassed June's TVL and recovered their May levels, accounting for a market share of 5.4% (Polygon) and 2.9% (Terra). As the size of DeFi deployed on Polygon and Terra chains gradually expand, more and more platforms are considering deploying on different chains. They are expected to become strong contenders for the Coin Smart chain in the near future.
We have further cross-chain analysis from the top two TVL ranked Ethereum and Coin Smart chains.
**1.TVL**
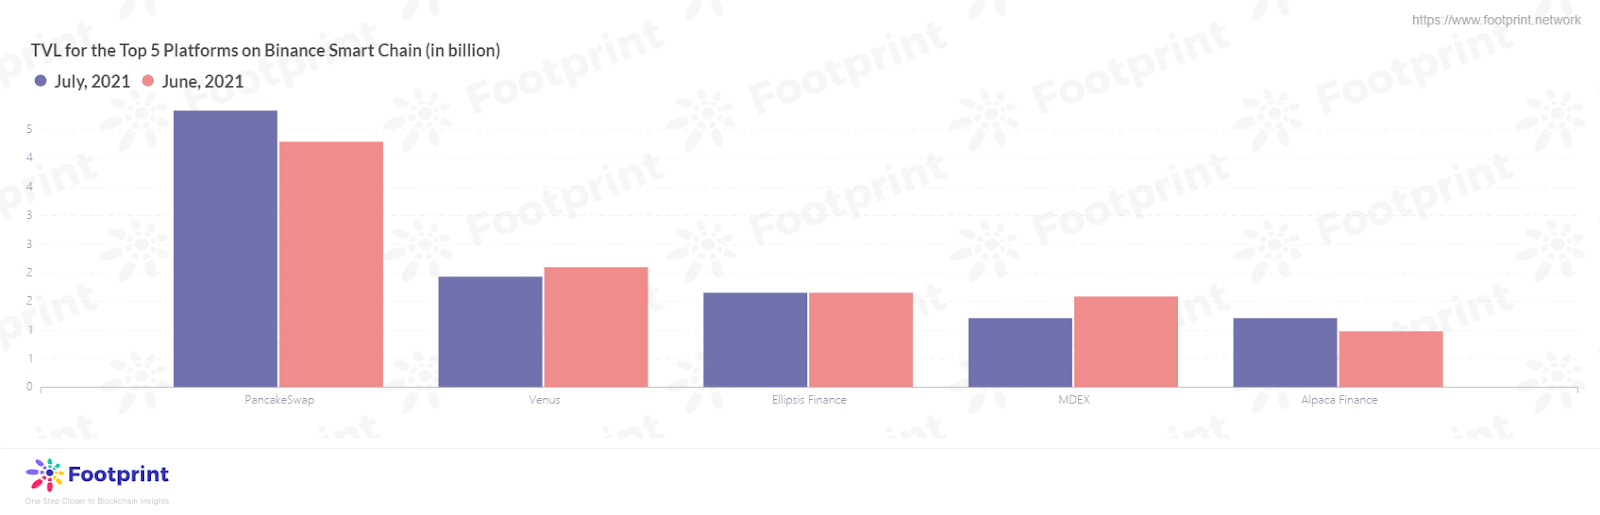
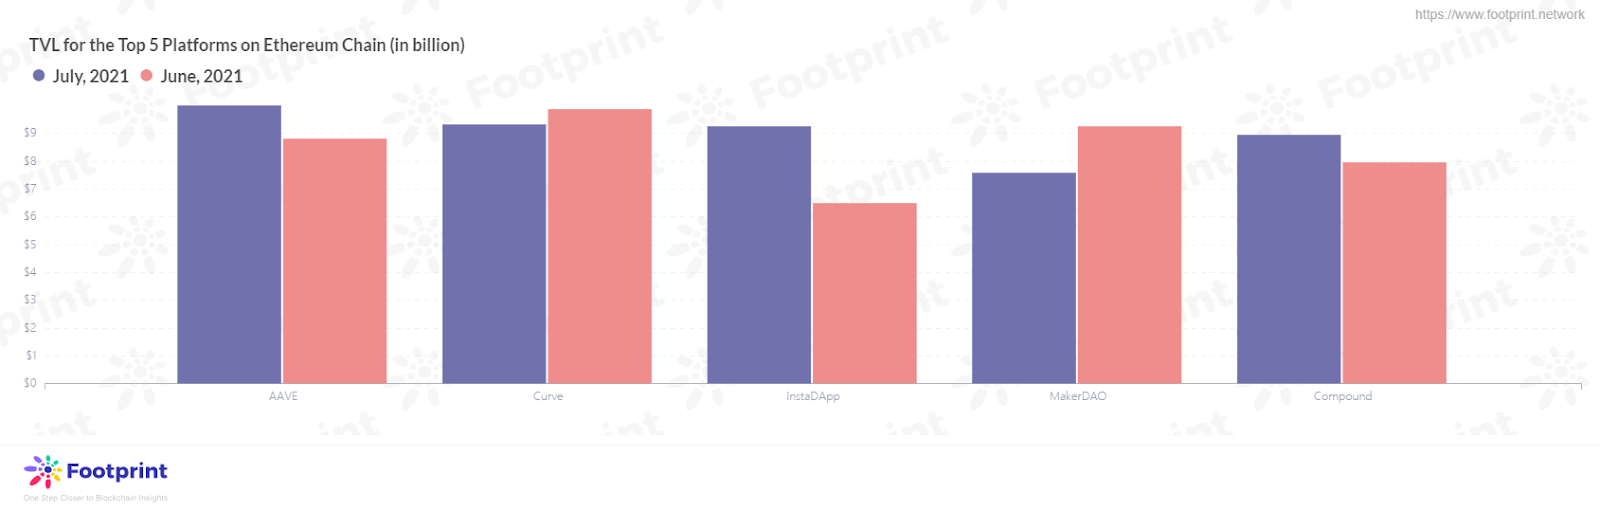
**Lending, Asset Management and Yield Aggregator platforms saw varying degrees of increase in July**
Taking a closer look at the platforms that contributed more to the TVL of the Ethereum and the BSC, Aave ($9.99 billion, +13.3% MoM) was the highest contributor to the Ethereum, followed by Curve ($9.31 billion, -5.8% MoM), Compound ($8.95 billion, +12.3% MoM), InstaDApp ($8.73 billion, +34.7% MoM), and MakerDAO ($7.59 billion, -17.9% MoM).
Why is InstaDApp gaining ground so quickly among all the other projects? We see from the data output by Footprint that the second-highest growth rate after InstaDApp is in the lending category. With its powerful features such as one-click debt transfer, debt swap and collateral swap, InstaDApp allows users involved in lending investment activities to convert assets between different agreements. This functionality provides users with a cross-platform transaction "bridge" that makes operating on multiple lending platforms easier while reducing transaction costs.
The most significant contributor to the BSC was PancakeSwap in the Dex category, with a TVL of $4.83 billion in July, up 12.9% from June and accounting for 33.2% of the overall BSC's TVL. In terms of growth rate, the highest growth rate was achieved by Alpaca Finance, with a growth rate of 23.5%.
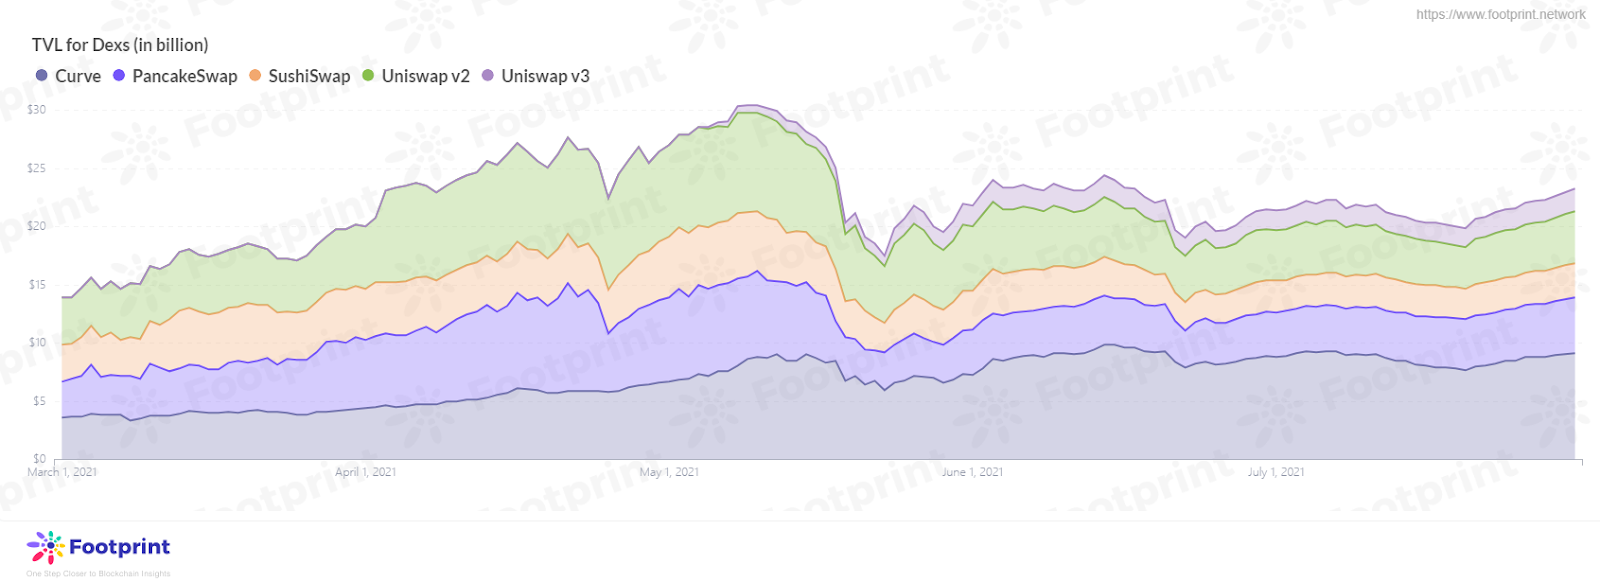
**Curve continues grow on decentralised exchanges as PancakeSwap overtakes Uniswap V2 in second place**
As the crypto market recovers, TVL for DEX platforms gained in July.
PancakeSwap, which grew 27.1% MoM from June, was the highest gainer in the head DEX category, followed by Uniswap V3 (+11.1% MoM), SushiSwap, (+8.7% MoM), Curve (+2.5% MoM), and Uniswap V2 (+1.8% MoM).
PancakeSwap, which had the highest growth rate for the month, made a significant breakthrough in July, overtaking Uniswap V2 in second place in the TVL rankings for the DEX category.
Although Curve held a modest TVL growth rate for the month, it has been popular. It has held the leading position by offering low transaction fees for trading multiple classes of stablecoins and CRV token mining. However, there is no denying that introducing the new AMM mechanism, which can provide liquidity providers with more flexibility, will be a solid rival to PancakeSwap and even Curve in the future.
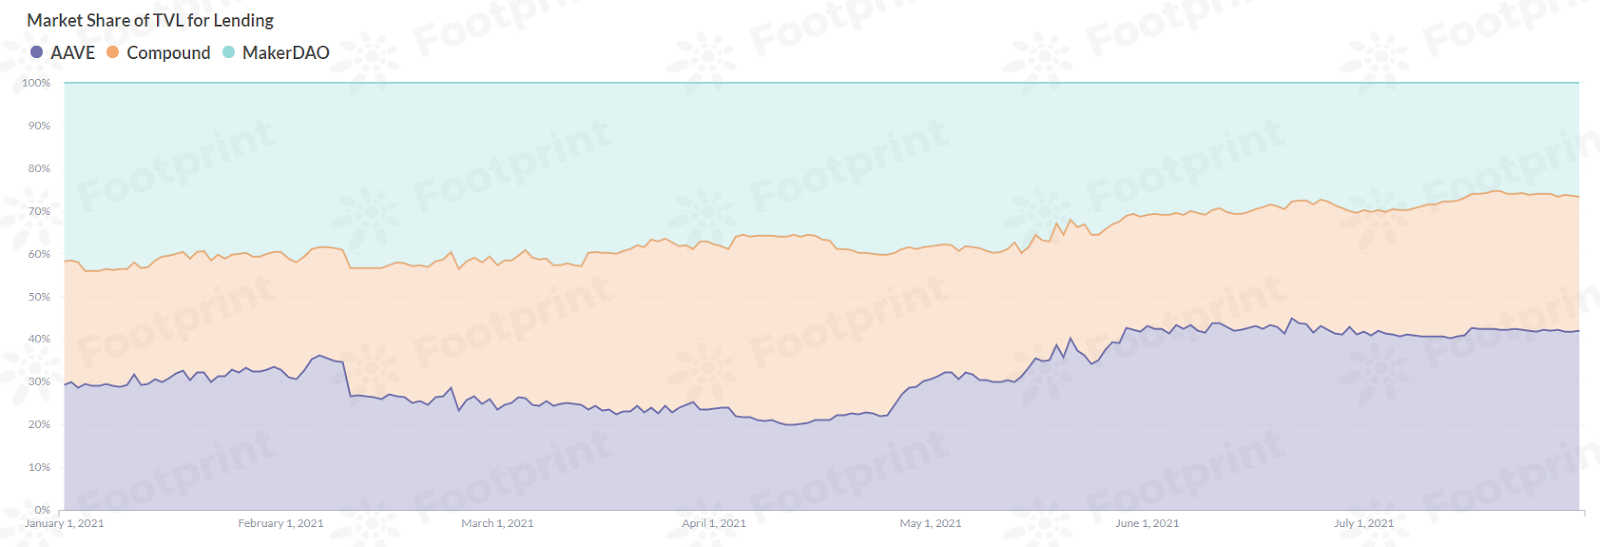
Aave continues to expand its market share in the lending category with TVL exceeding $10 billion
Aave's TVL performance topped other lending platforms. Up to $11.97 billion—or 27.1%—from June, it's the first lending platform to exceed $10 billion, accounting for 42% of the market share.
Compound's TVL was up 37.5% compared to June, but the May dip cut this in half. The higher growth rate only allowed Compound to maintain its market share at a level relative to June, accounting for 31%.
On the other hand, MakerDao's market share has been shrinking this year, accounting for only 27% in July.
**2.Lending**
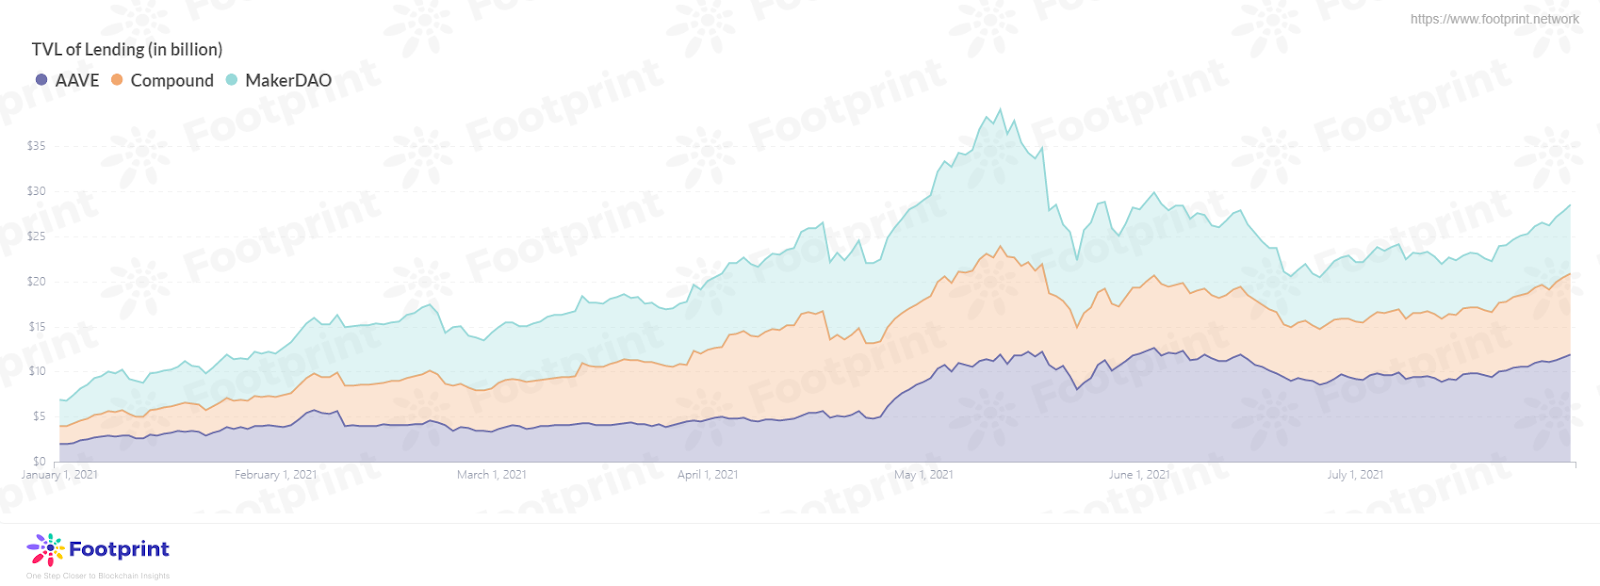
**Aave's deposit volume at record high, Compound's deposits up 74.7% MoM**
According to data provided by Footprint, the lending platforms ended July with a deposit balance of $37 billion—not quite back to the all-time high deposited in May. However, with increased user acceptance and demand for DeFi lending, the category is expected to set new records for deposit volume in August.
As the current leader in the lending category, Aave's deposit volume in July reached a record high of $16.5 billion, up 32.1% MoM from June and 11.3% from the $14.8 billion set in May this year.
Aave is closely followed by Compound, which also achieved good results in July, with a Deposit volume of $14.5 billion, up At 74.7% MoM. It has not yet returned to the $17.4bn generated in mid-May, but August is expected to see it surpass May levels and possibly overtake Aave with its higher growth rate.
On the contrary, the impact of the May cryptocurrency price crash was significant and sustained for MakerDAO. After a steep drop in deposit volume in mid to late May, it has remained in the range of $5-6 billion for the past two months. In July, when the deposit volume of other platforms was growing at a rate of more than 30%, MakerDAO's growth rate in July was only 10.3%, well below the industry average. If we expect MakerDAO's August deposit volume to return to the $13.7 billion set in May, the chances of that scenario coming true are slim.
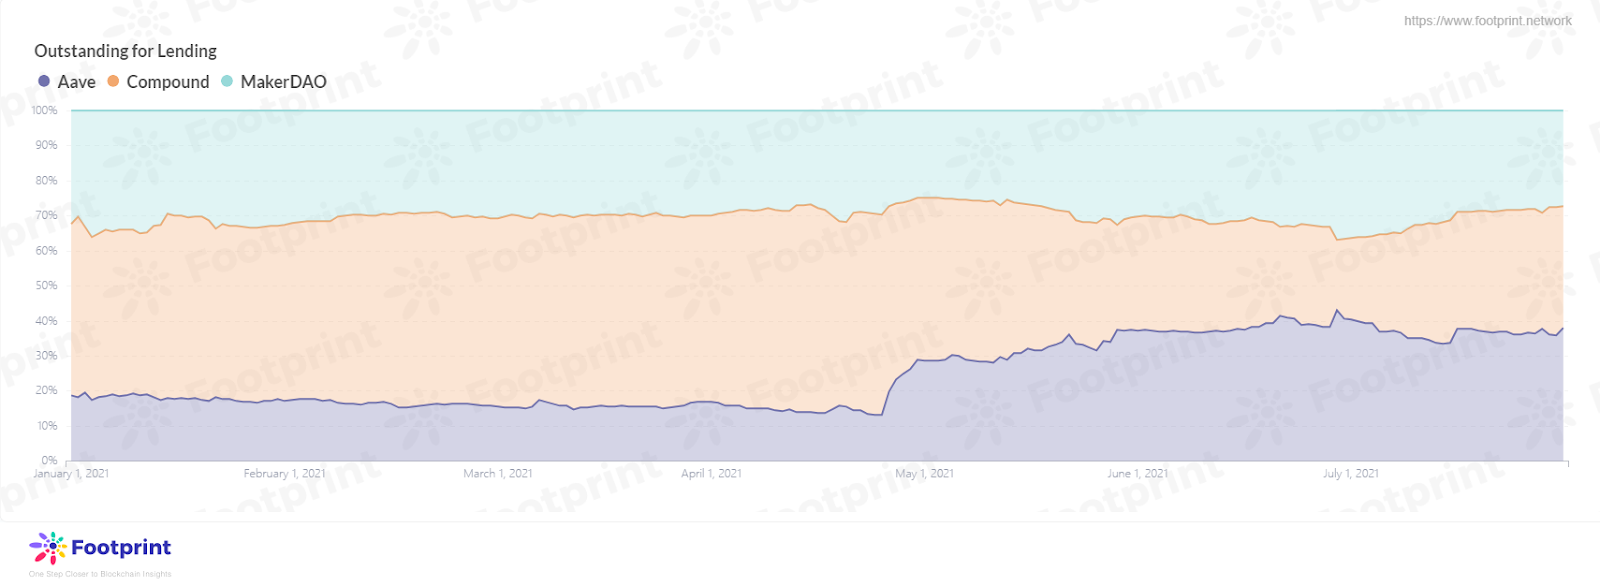
The top three lending category platforms are leveling out in terms of outstanding balance
Compared to June,with Aave representing the biggest market share of outstanding balance,the top three lending platforms share an even proposition in July. From the deposit data shown above, that of Aave and Compound is 3 times the size of MakerDAO. Combining the two indicators, MakerDao can be concluded to have the highest capital utilization of the three. However, there are some new trends in the industry that are not conducive to the development of lending-type projects, such as loopholes in the contract, platform attacked, price plummeting, especially the shortfall event might increase the possibility of borrowing users being liquidated increases, and the operational risk of the platform increases.
**3.Market Cap**
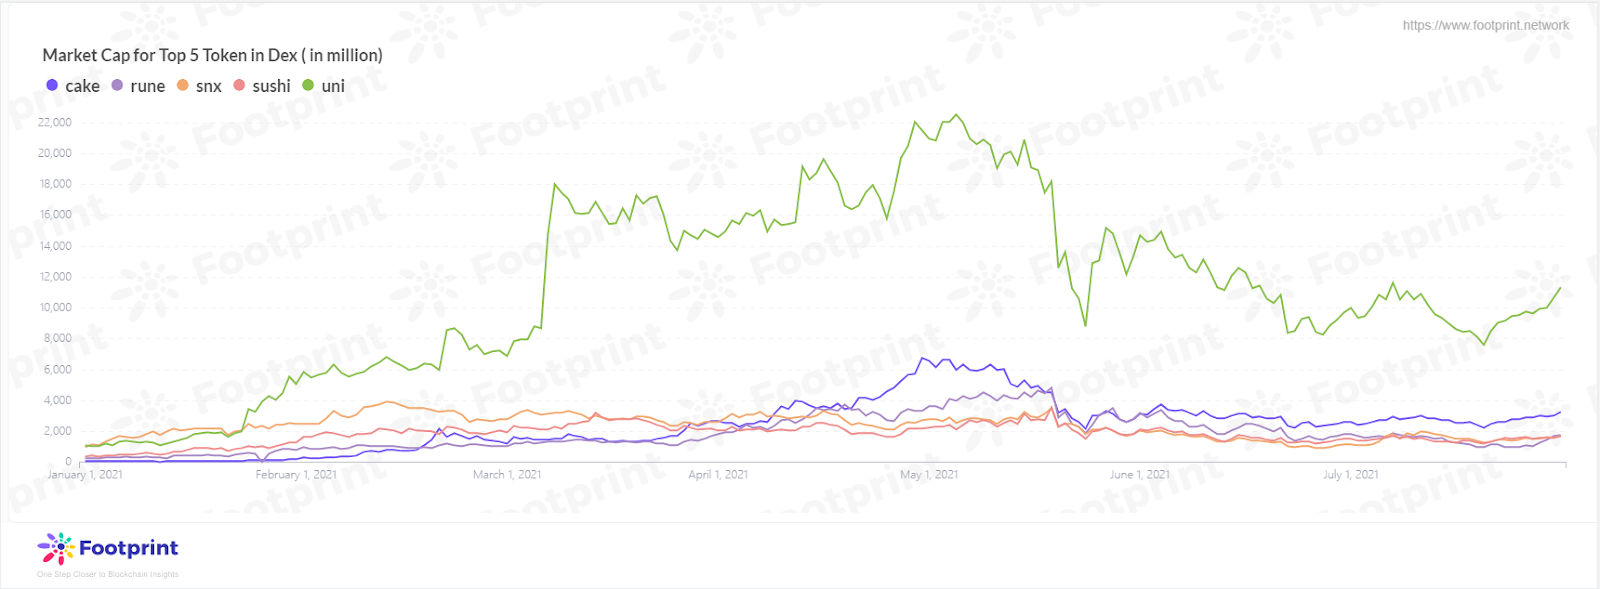
**Uniswap continues to hold the top spot in market cap among DEX platforms**
Throughout July, the Dex-like platform Token market cap rose the most for Synthetix Network, up 46.6% MoM, although it sits in fifth place, just $1.4 million away from Sushiswap in fourth place. It seems likely that Synthetix Network will overtake Sushiswap, THORChain and PancakeSwap to return to the number two position it held at the beginning of the year.
For Uniswap, which continues to hold the top spot, there is still a double difference in market cap in July compared to its peak in May due to the drop in coin prices. Still, as mentioned above, Uniswap continues to make upgrades and iterations to create higher returns for liquidity providers, and its market cap is expected to increase in the future.
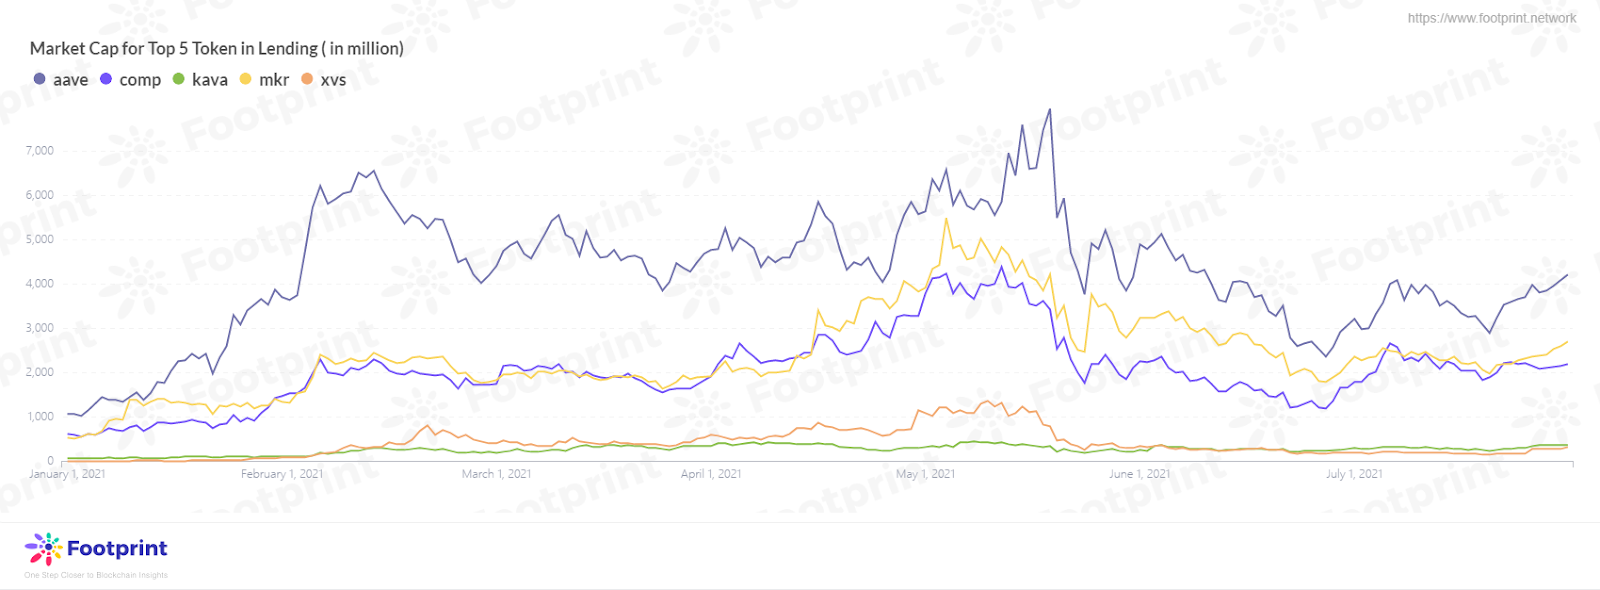
**MakerDAO regains 2nd place in by market cap among lending platforms**
Unlike June, lending platforms had a thriving July. None were stronger than AAave, with a market cap of $420 million, up 37.5% MoM from June. The competition was fierce in positions 2-3, with MakerDAO finally making a push at the end of July to finish in 2nd place with $2.75 billion, outpacing Compound by $514 million, and its growth rate for the month was not bad at 23.4%. In 3rd place, Compound also performed well, with a growth rate of 31.2%, gradually catching up with the 2nd place. Kava and Venus, in 4th and 5th place, were not far behind the Top 3, but they also showed varying degrees of growth in July, with Venus in particular up 55.1% for the month.
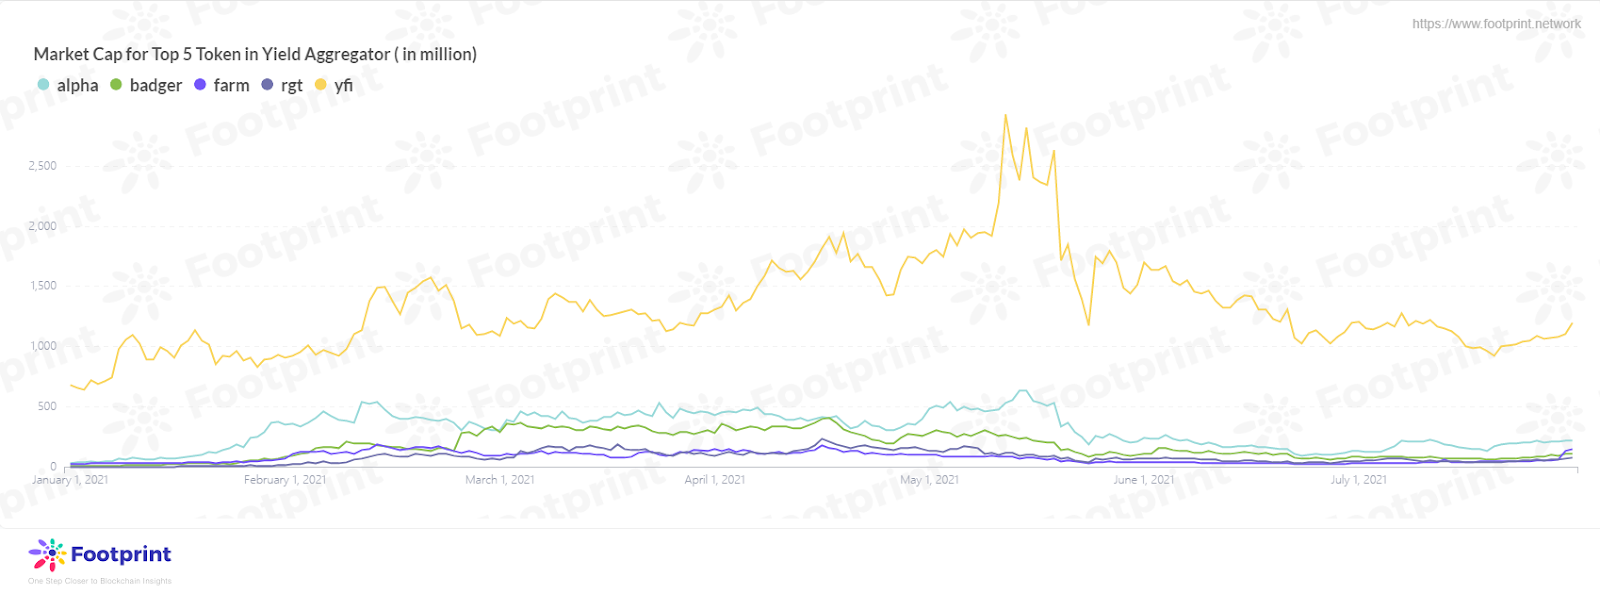
**Harvest Finance sees 367.7% growth in July, gaining momentum**
The best performer was Harvest Finance in July, which returned to the billion-dollar level this month with a market cap of $148 million, up 367.7% MoM from June. With the rapid growth of Harvest Finance, Rari Governance and Alpha Finance, the market share of the upper billion-dollar level of Yearn Finance remained constant. Although it maintained a relatively stable market cap in July ($1.197 billion), its Top 5 Yield Aggregator share has fallen to 68.1% of the market cap, down from 80% in June.
According to Footprint data, different categories of platforms and various indicators show that the crypto market has gradually recovered in July, and platforms are working hard to create better DeFi applications
The indicators point to August developing more positively than July.
Apart from that, in August, the Etherchain will complete the hard fork upgrade of EIP-1559. Keep an eye out for the August report, where we will examine whether transaction congestion and high Gas fees in the Etherchain have improved.
# 2-ABCs of DeFi Data Analysis for Beginners
Author: Jimmy\@Footprint, Aug 2021
It’s not for nothing that the summer of 2020 has been called the “DeFi summer”.
But since then, DeFi has only continued to grow. The Ethereum ecosystem saw enormous development, the number of wallets has grown to 3 million addresses and the daily TVL (Total value locked) reached $100 billion dollars.
What’s more, this TVL didn’t crash when the market prices of tokens fell in June.

\
At its most basic, decentralized finance is the opposite of centralized finance. Leveraging decentralization, transparency, standardization and security, DeFi promises to gradually bring traditional finance activities on the chain, transforming this industry.
In this article, we’ll use DeFi data taken from [Footprint](https://www.footprint.network/) to illustrate some of the key terms and concepts in this space.
**DEX**

DEX, or decentralized exchange, is a peer-to-peer (p2p) online service that allows direct cryptocurrency transactions between two interested parties.
In the chart above, you can find the DEX volume of Q2 2021. This refers to the total amount of dollars that has been traded or held on the DEX. As you can see, the volume increased 80% over Q1 2021, and 1000x year-on-year. The volume of DEX has now reached 10% of centralized exchange volume and keeps increasing—July’s hitting 153 billion.
This indicates that DEX has become more and more popular among crypto investors . Someone who is just starting to explore DeFi and blockchain data with a tool like Footprint can therefore track DEX volume to find the leading players.

According to Footprint, data shows that Uniswap has become top DEX in market volume since the release of the Uniswap V3 protocol, which is designed to increase capital efficiency by increasing the capital efficiency by 4,000 times compared to V2. Uniswap V3 allows liquidity providers to set customized price ranges of market-making, for example to set bottom prices higher than current prices or vice versa.
It’s also important to know that there are also dozens of new or niche options as well. Since the world of cryptocurrency is notoriously volatile, an unheard of DEX today can easily grow to a major player next year.
Knowing that Uniswap V3 has the largest volume, you can be confident it will have less trading slippage—which refers to situations in which a market participant receives a different trade execution price than intended—and higher rewards for LP.
**Lending**

After exchanging the tokens needed through a DEX, investors can meet the requirements of depositing and borrowing through DeFi lending platforms. The TVL of the main lending platforms in Q2 2021 has increased over 4 times over Q1, and 25 times compared with Q2 last year. July’s TVL was 19 billion.

Among the lending platforms, Aave, which went public in 2020, has taken the lead position in terms of market share since June 2021. Aave offers “flash loans”, which allow users to borrow any available amount of assets without putting up any collateral, as long as the liquidity is returned to the protocol within one block transaction.
Compound, which launched in 2019, went in the other direction. Its flagship product is Compound Treasury, designed for non-crypto businesses and financial institutions.
Looking at the rate of outstanding loans divided by deposits of Aave and Compound, the capital efficiency of Aave increased significantly since May.
\
**Yield Aggregators**

Whereas traditional, centralized finance uses asset management, DeFi uses yield aggregators. Yield aggregators playing a key role in the yield farming economy by leveraging different DeFi protocols and strategies to maximize user profits. The yield farming process usually requires investors to lock up or stake funds, providing variable or fixed ROI in return.
Yield aggregators only hit the mainstream last June, but their TVL has already reached $5.69 billion in July. TVL of yield aggregators increased 130% from Q1 to Q2. Last month’s TVL was 5.69 billion.
Since yield aggregators have become a mainstay of DeFi investing, Yearn Finance has always led the pack. Yearn gained $18 million in revenue in Q2, which is 236% more than Q1.

The DeFi project has undoubtedly had its summer since last year, and this year the DeFi project has experienced some ups and downs, but it is still undeniably thriving. The changes the DeFi project can bring to our financial world in the future are even more worthy of our anticipation.\
\
Footprint Website:
Discord:\
Footprint is a powerful yet easy-to-use analytics tool to uncover and visualize blockchain data. The product puts user experience first—whether you’re an analyst, data scientist, developer, student, teacher, or executive. It provides an intuitive, drag-and-drop interface for interactive data queries.
# 3-Footprint August Monthly Report Will September bring the next breakout point for crypto?

**Written by **
**Date: 2021/09/09**\
\
Since our [July 2021 Report](https://www.footprint.network/guest/dashboard/ea4ad38d-08e4-41cf-a220-0e0bdfe10c46#secret=ED7A61266A0146012C62304105503058), the market gradually recovered and the DeFi market got infused with more products, funding and users in August, with the emergence of new players stirring excitement. The token incentive policy for liquidity mining was launched, and the total value locked in each blockchain’s DeFi protocol also rebounded rapidly, setting new historical records again in most blockchains.
\
Next, the data indicators in Footprint's August monthly report [August 2021 Report](https://www.footprint.network/guest/dashboard/83ce68ae-a4df-4a39-9033-55782a0db772#secret=F84B4A448579ABD0317AD83BE94FA8D4) will be used as a starting point to review the overall situation of the DeFi market and predict what will happen in September.
**一、Analysis from the data indicators of each blockchains**


**TVLs on multiple chains trending upward, Solana and Avalanche emerging blockchains growing rapidly**
According to data provided by Footprint Analytics, the TVL of multi-chains in August was $162.8 billion, with a 32% MoM growth rate. Among them, Ethereum occupied the top spot with $126 billion, with a 30% MoM growth and 77% of the market share. Importantly, the hard fork upgrade of Ethereum EIP-1559 also introduced a destruction mechanism, marking an extremely important protocol change in the history of Ethereum. As of August 31, the EIP-1559 adoption rate accounted for nearly 50% of all ETH transactions and the TVL of Binance Smart Chain (hereinafter referred as “BSC”) increased by 27% MoM to $19 billion, a slow increase in terms of the overall trend.
**Solana and Avalanche**
As of August 31, Solana and Avalanche entered a solid market with a total of over $5 billion in locked-in capital, growing approximately 200% and 900% MoM. The Solana ecosystem's native cryptocurrency, SOL, hit an all-time high, climbing from $36 on July 31 to $107 on August 31, up 197.2% MoM, while the Avalanche token, AVAX, which peaked at $56 since its release in February, set a new record high of $58 on August 24, up 427.3% MoM from July 24. The increase was 427.3% compared to July 24.
However, with the rapid development of emerging blockchains such as Solana and Avalanche, DEX on each Blockchains is indispensable as an important part of DeFi, making the entire DeFi space more competitive.


**Lending, asset management, and machine gun pool platforms had varying degrees of growth in August**
The overall contribution of the Top 5 Ethereum platforms are all trending up from July, namely Aave ($12.19 billion, +21.9% MoM), Curve ($12.13 billion, 30.3% MoM), InstaDApp ($12.1 billion, +30.8% MoM), Compound ($1.17 billion, +30.5% MoM), and WBTC ($970 million, +19.8% MoM). Among them, it is worth mentioning how WBTC squeezed into the Top 5 platforms for tool chain among many projects, squeezing out the original MakerDAO, which ranked 4th in July, from the Top 5 position. WBTC implements the first mapped token model of bitcoin asset bridge, whose operation model is very similar to stablecoin, and also uses centralized escrow operation to lock bitcoin from the bitcoin network as a reserve**.**
WBTC is the first bitcoin asset bridge that uses a centralized escrow operation that locks bitcoin in the bitcoin network as a reserve, and issues 1:1 convertible ERC20 tokens on ETH for users to hold exposure and enable related transactions.
The top 5 platforms of BSC have risen and fallen, among them the biggest platform for BSC in the Dex class is PancakeSwap ($6.54 billion, -40.2% MoM). While the recent participation of Phala Network in the PancakeSwap syrup pool that provides liquidity mining has not brought a boost to BSC's TVl. Maybe it has not caught the attention of major investors or other reasons worth your thinking. Then, from the growth rate, the increase change is larger for Tranchess, whose TVL in August exceeded 1.26 billion, a MoM growth rate is 950%, The rapid growth can be attributed to the fact it can dismantle Queen, one of the tokens on its ecosystem, into two different risk-return sub-fund products. This allows it to achieve an efficient and open chain asset management to meet the needs of investors with different risk preferences. Tranchess, being in the initial growth rather than explosion period, should be expected to have a promising future.
**二、Changes in indicators for different types of DeFi market**

The three main types of Dexes, Lending and Yield have accounted for 45.2% of the DeFi market.
**The following is an analysis of TVL, Market Share and other indicators for each of the three types of Dex, Lending and Yield**
**1、Dexes**

**Curve continues to play decentralized exchange role as Balancer overtakes Uniswap V3 in fifth place**
The TVL of Dex category platforms slowly rose in August. Curve (+33.1% MoM) saw the highest increase in the head Dex category and has been occupying the lead position over PancakeSwap (+19.7% MoM), Uniswap V2 (+9.1% MoM), SushiSwap (+28.5% MoM), and Balancer (+16.9% MoM). In August, Balancer overtook Uniswap V3 in fifth place. The principle of Balancer's initial token offering is similar to that of Uniswap, creating a Liquidity Bootstrapping Pool, which improves the efficiency of the project's capital, and the price pressure formed by the adjustment of the ratio of assets in the trading pool, and the price increase formed by participants' purchasing behavior. The price pressure formed by the adjustment of the ratio of assets in the pool and the upward price momentum formed by the purchasing behavior of participants jointly determine the price of the token.

**Uniswap still holds the top spot in market capitalization in the Dex category, but the highest gainer is PancakeSwap**
From the data provided by Footprint Analytics, the highest market cap increase for Dex-like platform tokens is PancakeSwap, with a market cap of $4.9 billion, up 49.4% MoM.
Since this month the decentralized exchange Uniswap surpassed Coinbase, the largest centralized exchange in the US, for the first time in terms of trading volume. This is all thanks to the token incentive of an emerging project, Sushiswap, which provides liquidity to its users. The subsequent liquidity of Sushiswap could grab a large number of customers and increase its market cap. The future is promising.
### **2、Lending**


**Aave's market share in the lending category decreased slightly as Compound's total TVL exceeded $10 billion again since May of this year**
From the data provided by Footprint Analytics, Aave's TVL in August was as high as $14.27 billion, up 19.2% MoM, accounting for 40% of the market share, a slight decrease of 2% market share relative to July, but it did not affect its leading position in the lending platform. Compound's TVL in August again exceeded $11.68 billion, up 30.5% MoM, affected by the TVL impacting its coin price, slowly rebounding to $515. The higher growth rate also allowed Compound's market share to remain level relative to July, accounting for 33% of the market share. MakerDao’s market share has shrunk slightly.

**Aave's deposit volume has surpassed May levels, Compound's deposits up 13.33% MoM**
From the data provided by Footprint Analytics, the deposit balance of the head lending category platform was $43 billion at the end of August, up 16.2% MoM.
The lending market did not continue to grow rapidly, but also gradually recovered to the highest deposited volume of $47 billion in May. As the head of the current lending category, Aave's August Deposit volume has reached a record high of $19 billion, up 18.8% MoM, having surpassed May's highest Deposit volume of $15 billion. According to reports, Aave's e-money institution license (EMI), applied for from the UK Financial Services Authority, allows Aave users to buy Aave through fiat currency. This could allow it to emerge in the mortgage lending market in September.
Compound, with a deposit volume of $17 billion, went up 13.3% MoM. Compound's deposit volume grew insignificantly in August, but it is still an attractive market for borrowers.
On the other hand, borrowing volume in MakerDAO is still growing due to the demand for DAI in decentralized applications, and deposit volume remains in the range of $6-7 billion.

**The head of the three major lending class platforms tend to balance the external lending balance**
The market share of lending balances held by the three major platforms in August tended to balance each other out. It is clear that MakerDAO has the highest capital utilization among the three, and the funds deposited by borrowers are basically used for lending. Maker has proven itself to be one of the most powerful stablecoins and lending markets in DeFi.\
\
\

**Compound regains #2 spot for market cap in the lending category**
The market cap of the top five lending class platforms at the end of August was $8.1 billion, down 16.9% from the previous month. The strongest platform was Aave, which broke through again with a market cap of $5.1 billion, up 20.7% from the previous month, the largest increase in the lending class. Compound returned to 2nd place in the lending category, with a market cap of $2.4 billion, up 7.7% from July, an insignificant increase, but pushing MakerDAO, which was in 2nd place last month, out of the Top 5.
The winner of the fastest growth in August is TRU, the token of TrueFi, gaining a MoM growth over 270% and tripling its market cap compared to previous month. The reason is the innovation of TrueFi that introduces the credit auditing mechanism of borrowers, which has caused a significant increase of its outstanding loan amount since its launch in May. In the future, according to TrueFi’s official report, it will expand the selection of lending assets to major ERC-20 tokens.
**3、Yield**

**Machine gun pool class platforms in August have different degrees of increase, momentum is highest in Tranchess**
From the data provided by Footprint Analytics, as of August 31, the head machine gun pool platform TVL was $17.78 billion, up 47.5% MoM, two times more than the lending market MoM growth rate, of which Convex Finance ($7.24 billion, +59.2% MoM), occupied the leading position of the yield category platform. Momentum is highest in Tranchess ($1.26 billion, +950% MoM), the reasons for which are mentioned in the analysis of the BSC chain in this paper. Autofarm ($3.13 billion, +25.9% MoM), saw its TVL reach $3.1 billion since its launch in early June.

**PEAKDEFI grows 271.45% in August with strong momentum**
The market value of PEAKDEFI is $300 million, up 271.45% from the previous month, and it overtook ApeSwap Finance's market value of $250 million on August 25, coming close to Illuvium's market value at the end of August. Yearn Finance's market cap has improved somewhat compared to July, with a market cap of $1.37 billion, a 13.35% increase from the previous month, placing it at the top of the machine gun pool category.
From the data provided by Footprint Analytcis above, DeFi has formed a trend to expand from ethereum to other chains, solving the problems of ethereum to varying degrees, while providing a healthy and complete environment for more users. Will there be more breakout points? In addition, most of the tokens fell in early September. What will be the impact on the future market? All that will be covered in our September report.
**Review of various events in August:**
1. Chain:
1. Avalanche Rush to Distribute Over $180 Million in DeFi Awards
2. Avalanche Adds SushiSwap to Liquidity Mining Program Avalanche Rush for a Total Reward of $15 Million
3. Total lock-up volume on the OEC chain surpasses $2 billion
4. Poly Network attacker buys Crypto Punk 3100 for 42,000 ETH
5. All funds stolen in Poly Network attack have been returned
6. Total Avalanche lock-ups reached $2.01 billion, with inflows of $1 billion in the three-day period from 22 to 25
7. Polygon's First Global Hackathon to Kick Off at HackerLink on August 30 with $100,000 in Total Prizes
8. Celo also announced in August the launch of its $100+ million "DeFi for the People" project with Aave and Curve, among others, to enable the use of DeFi on mobile
2. Stable Coins:
1. Uniswap, Curve holdings of stable coins have reached centralized exchange levels
2. Solana overtakes USD Coin in 8th place by market cap
3. Tether Issues 1 Billion Additional USDTs on Wavefield Network
3. Trading volume:
1. DEX trading volume for the month was $72.54 billion, down 15.4% MoM
2. DeFi lockups top $157 billion, a record high
4. Gas fee
1. EthHub Co-Founder: Once EIP-1559 is implemented, every DEX transaction on Layer 1 must pay for gas in ETH
2. Ether developer trent: users try the new EIP-1559 function and other 5 major reasons for the high price of gas
3. Ethernet Core Developer: EIP-1559 Reduces ETH's Annual Inflation Rate from 4.2% to 2.6%
4. EIP-1559 adoption has accounted for nearly 50% of all Ether transactions
5. NFT:
1. NFT trading marketplace OpenSea reaches $547 million in cumulative volume in August, up 68% from July
2. Axie Infinity's agreement revenue in the past 30 days exceeded RMB 1 billion, 7 times the combined total of #2-10
3. CryptoPunk's average trading price rose 68.2% in the past week, with total trading volume exceeding $120 million
4. OpenSea, the NFT marketplace, approached $100 million in trading volume over the weekend
6. Lending
1. DeFi Lending Agreement Aave V2 Lockup Tops $11 Billion, Hits Record High
2. Total Maker borrowings top $6 billion, a record high
7. Dex
1. Uniswap V3 Introduces Full Range of Mobility Capabilities to Emulate V2
2. DEX July trading volume at $56 billion, 65% from Uniswap
3. O3 Swap relaunches USDC cross-chain pool and announces NFT rewards for backers
8. Ethereum Gas
1. As of the completion of the Ether London hard fork upgrade, 3,200 Ether were burned in 12 hours
2. Total value of ETH destroyed by Ether hit $400 million, destruction volume exceeds 126,000 pieces
About Footprint Analytics
Footprint Analytics is an all-in-one analysis platform to visualize blockchain data and discover insights. It cleans and integrates on-chain data so users of any experience level can quickly start researching tokens, projects and protocols. With over a thousand dashboard templates plus a drag-and-drop interface, anyone can build their own customized charts in minutes. Uncover blockchain data and invest smarter with Footprint.
Footprint Website:
Discord:
WeChat: Footprint Blockchain Analysis (FootprintDeFi)
# 4-Footprint September Monthly Report
How Did the Crypto Market Change in September with the Introduction of National Policies?

Oct, 2021,
The crypto market industry saw its first cold winter of the year in May, as mainstream cryptocurrency prices plummeted and the industry's Total Value Locked (TVL) fell below $90 billion due to the impact of national policies in several countries.
Just over three months later, the crypto market once again saw an even tougher policy challenge in September, with several countries stepping in to introduce various regulations.
To see the month’s most important data visualized, [see this Footprint dashboard.](https://www.footprint.network/guest/dashboard/9e13bf17-627a-4636-b984-4a701effcf94?this_month=2021-09-30\&last_month=2021-08-31\&date_range=past6months~\&daterange=2021-09-01~2021-09-30#name=September%202021%20%20Report\&secret=8B4F8A1F25E15FCB7713A7C35E4D762D)

**BTC and ETH prices remain stable as policies introduced**
The price of BTC and ETH has a strong effect on all tokens except stablecoins.
From the data in the chart, it can be seen that the introduction of the relevant policies in September did not have the same impact on the prices of BTC and ETH as it did in May (BTC fell from $58,000 to $35,000 and ETH fell from $4,200 to $2,000), with BTC holding above $40,000 and ETH maintained a level above $3,000. The price of the coins did not fluctuate and the overall cryptocurrency market tended to be stable.

**DeFi had a TVL of $182.2 billion at the end of September, up 7.2% from the previous month**
Compared to August, TVL in September was buoyant, topping $190 billion at the beginning of the month, a record high for the year. Although TVL declined slightly in mid and late September to varying degrees, even falling below $170 billion, the extent of the decline and the duration of the effect was far less than the impact of the policy change in May.
The crypto market stayed resilient, with investors avoiding panicking.

**Older blockchains are slow to develop, but new ones are bursting on the scene**
According to data provided by Footprint, the TVL and market share of TVL for Ethereum and Binance Smart Chain in September gradually were reduced by emerging blockchains. On the other hand, emerging blockchains are gaining momentum. Solana is the main example and ranked 5th in blockchains in August with $3.33 billion TVL and was already 3rd in September with $9.79 billion (this chain had surpassed $12 billion in mid-September).
Avalanche, which has grown as a result of liquidity mining, is also doing well, ranking 6th on the public chain with $3.68 billion. (Footprint has already analysed a number of emerging blockchains: [What’s so special about Solana? ](https://docs.google.com/document/d/1SIzJz_NTZIhmXDoaMI0hJ6UUcea0orSSfb7t0tLHztg/edit?userstoinvite#), [Footprint: The blockchains battle breaking out,Avalanche gaining momentum](https://docs.google.com/document/d/1zy754XYJOQnXHaNZOiGE2hCSU1mYcUUX4aRmdeiSsY0/edit#heading=h.er52wdbsvto5))
With the introduction of Korea's policy to shut down two-thirds of cryptocurrency exchanges, the development of Terra, which is based in Korea, suffered somewhat in September, dropping it from third to fourth place overall in the blockchain rankings, with its TVL growing by just 14.1%. For comparison, Solana grew by 193.9% and Avalanche by 74.41%.

**New blockchains show promise as they see rapid growth**
The highest TVL growth rate was recorded by Arbitrum, which is part of Layer2. With lower transaction fees and faster transaction speeds compared to Ethereum, Arbitrum has attracted an influx of funds and project owners (Curve and SushiSwap are now online). With a growth rate of 856,323.64% (TVL from a little over $100,000 to $1.3 billion), it not only came out on top of the growth rate of many blockchains, but also stood out among the many Layer2 projects.
It was followed by OKExChain, which seized the opportunity to develop an infrastructure conducive to the development of GameFi and launched the GameFi Hackathon, attracting many projects to go live on the chain and achieving a growth rate of 3,470.16% in September.
Moonriver came in third with a growth rate of 2,195.26% with $220 million in the same month. It has both the cross-chain advantages of the Polkadot ecosystem and strong compatibility with Layer1, which provides a better experience for developers and users.

**DEX, Lending, Yield continue to dominate DeFi's headlines**
As in August, DEX, lending and yield were the top three DeFi market share categories. DEX occupies the first place with 30.55%, although there was a 0.34% decrease in the share compared to last month. However, with large centralized exchanges like Binance and Huobi affected by restrictive policies in certain countries, more trading volume and funds have flowed into DEXs, thereby increasing the TVL of this category by $3.61 billion.
The lending category, on the other hand, has been affected by the decline in token prices. It not only reduced the amount of funds involved in the lending business, but also increased the risk of liquidation of the original borrowed funds, so the TVL of the lending category is down compared to August, and although it continues to maintain the second position, its percentage of market share has dropped by 2.63%.
Yield came in third with TVL of $30.34 billion representing 16.65% of the market share and the highest TVL growth of any category with an 18.74% increase compared to the previous month. The most prominent contributors were Convex Finance ($7.93 billion) and Yearn Finance ($4.69 billion).
**Summary**
The impact of the government regulations in September on the crypto market was not significant. After significant volatility in May, the crypto market had a certain immunity to the changes in policies and it continued to develop with good resilience and tension.
Emerging blockchains are gaining momentum, and those that have already stood out are expected to reach new heights next month, while those that have yet to emerge will also sprout one after another. For the old blockchains that are slow in development, as their carrying capacity increases, congestion will become more and more serious and their position will gradually be overtaken by the emerging blockchains.
**A review of policy events in September:**
DEX aggregator 1Inch begins restricting to US users, aiming to pave the way for the launch of compliance product 1inch Pro (30th Sep)
China issues notice on regulating virtual currency “trading speculation” activities (24th Sep)
India's largest bank SBI bans crypto exchanges from using its UPI to collect payments (15th Sep)
Russia's central bank advises banks to block cards and wallets used to trade with cryptocurrency exchanges (15th Sep)
Two-thirds of Korea's crypto exchanges to close in September (13rd Sep)
Singapore's MAS Adds cryptocurrency website Binance.com to Investor Warning List (1st Sep)
Footprint Website:;
Discord:;
Twitter:
What is Footprint Analytics
Footprint Analytics is an all-in-one analysis platform to visualize blockchain data and discover insights. It cleans and integrates on-chain data so users of any experience level can quickly start researching tokens, projects and protocols. With over a thousand dashboard templates plus a drag-and-drop interface, anyone can build their own customized charts in minutes. Uncover blockchain data and invest smarter with Footprint.
# 4-Footprint Weekly Report: Blockchain Fantom Surges, AnySwap Contributes Over 40% to Become the Larg

Oct, 2021,
**Overview of the week**
**I.TVL**
October 9, 2021:
This week, [Footprint Analytics data](https://www.footprint.network/guest/dashboard/33edf523-681b-47fa-be7d-fb6379c84205?date=2021-10-09#name=Weekly%20Report%20Dashboard\&secret=8311A15A2E5D46AACDC1747460437BF0) indicated that the TVL for DeFi blockchain projects is up 8.2% compared to last week, with a total TVL of $214.6 billion.
In first place is still Ethereum. While its TVL, currently at $142.3 billion, continues to rise, its total share of among all projects has been decreasing and now sits at 66.29%. This trend is due to emerging blockchains with cheaper transaction fees and smoother experience now garnering users’ attention.
With ecosystem incentive plans of hundreds of millions of dollars, each is trying to seize the market aggressively.

Among the blockchains, the fastest riser this week was Fantom, by 293.7%. Its TVL is now just $590 million away from Terra, the fourth-ranked blockchain. As of press time, Fantom has surpassed Terra and Solana to become the third largest blockchain behind Ethereum and BSC.
Fantom's surge comes mainly from the rapid climb of AnySwap and Geist since Oct. 7, with AnySwap's growth benefiting from increasing demand for cross-chain bridges. Geist, an Aave-based lending protocol, surpassed $10 billion in less than three days since its launch.
At the same time, Yearn also announced that it will go multichain with the launch of Iron Bank Fantom. Fantom has blown its trumpet in the blockchain battle with the Dex protocol AnySwap and the lending protocol Geist.

DEXs have continued to dominate this week, with overall TVL increasing by 3.14%. The top market ranking among the protocols remains Curve, up 7.33% from last week.

**II.Token**
BTC continued to rise this week by 14% in 7 days and 18% in 30 days, with prices remaining generally stable. It crossed $55,037.
On the blockchain token side, Fantom's token, FTM, was affected by TVL's surge this week, and the token price rose 45%. Luna, the token of Terra, ranks third in terms of rate of increase this week, up 11%. Although affected by South Korea's release of a policy to shut down some cryptocurrency exchanges, it appears this week that the release of this policy has had a limited impact, and Terra continues to grow steadily with its unique pattern.

In terms of token market cap, BTC is in first place, with a market cap of $103.72 billion. It is followed by Ethereum's token ETH ($442.4 billion) and Cardano's token Ada ($72.7 billion), respectively.
The number one stablecoin is still the centralized stablecoin USDT, with a market cap of $69.3 billion. In the decentralized world, centralized stablecoin USDT still occupies close to 3% of the market. The security of centralized institutions that rely on institutional endorsement is still worthy of gradual improvement in the centralized world.

In terms of tokens by category, this week's top token price in the DEX category is Quick ($424.65), in the lending category is COMP ($331.075), and in the yield category is Yfi ($34,076).
**III.Gas**
Total Gas fees used 81445.99 ETH this week, up 16.14% from last week; total burnt was 70851.69 ETH, up 34.17% from last week. This week's choice of transaction type 2 (the use of EIP-1559 users) accounted for 58.5%, down 0.63% from last week. Select EIP-1559 has been rising slowly for the last 6 weeks, with none exceeding 60%. Users also seem to be gradually realizing that choosing EIP-1559 does not reduce more fees, and the percentage of users who choose it has slowed down significantly recently.

**Weekly Highlights**
1.Oct. 3
Ethereum L2 TVL reaches $2.75 billion
Solana Eco NFT SMB #1355 sold for approximately $2.1 million, a record sale price for this eco NFT
OpenSea's day's trading volume reaches $138 million, a new post-September high
2.Oct. 4
Bitcoin sidechain Liquid Network plans to launch DynaFed permanent divergence upgrade
Public mining company HIVE Blockchain reports total mining revenue of $37.2 million for Q1 FY2022, up 466%
3.Oct. 5
Aave, the decentralized lending protocol, has been deployed to Avalanche
Total number of OpenSea traders exceeds 500,000
Bitcoin sidechain Liquid Network experiences block signing issues after upgrade, no blocks out for over 7 hours
MakerDAO founder proposes new token economy system, Sagittarius Engine, to make DAI an environmentally friendly currency
Circle, the issuer of USDC, is under investigation by the SEC and has requested some project information
4.Oct. 6
Bitcoin tops 55,000 USDT, new high after May plunge
Ethereum PoS infrastructure service Rocket Pool goes live on the main network
DeFi insurance protocol InsurAce deployed to Avalanche, opens mining and insurance business
Curve launches Avalanche and turns on liquidity mining rewards
Axie Infinity developer Sky Mavis closes $152 million Series B funding round
5.Oct. 7
The Department of Justice (“DOJ”) announced the creation of the National Cryptocurrency Enforcement Team (“NCET”) to investigate and prosecute criminal misuses of cryptocurrency
Astar Network and Shiden Network announce the launch of a $30 million eco-fund
Cross-border payments company MoneyGram partners with Stellar to settle transactions using USDC
6.Oct. 8
ETF issuer Volt Equity's crypto sector ETF has been approved by the SEC and will be listed on the NYSE under the new ETF symbol BTCR
Bitcoin market cap rises to 6th place in global market cap assets, surpassing Facebook
Yearn Finance begins multi-blockchain deployment, valut already supports some assets on Fantom
Crypto exchange Bakkt partners with Google, Bakkt Visa debit card supports Google Pay
7.Oct. 9
Cross-chain protocol Synapse Protocol goes live on Fantom
Polygon increases the Gas Price from the default of 1 Gwei to 30 Gwei
Footprint Website:;
Discord:;
Twitter:
**What is Footprint Footprint**
Analytics is an all-in-one analysis platform to visualize blockchain data and discover insights. It cleans and integrates on-chain data so users of any experience level can quickly start researching tokens, projects and protocols. With over a thousand dashboard templates plus a drag-and-drop interface, anyone can build their own customized charts in minutes. Uncover blockchain data and invest smarter with Footprint.
# 5-Footprint Weekly Report: BTC breaks $60,000 again, hits new high after May 19

Oct, 2021,
Weekly Report Dates: October 10 - October 16, 2021([Detailed data can be found by clicking on the link)](https://www.footprint.network/guest/dashboard/33edf523-681b-47fa-be7d-fb6379c84205?date=2021-10-09#name=Weekly%20Report%20Dashboard\&secret=8311A15A2E5D46AACDC1747460437BF0)
**This week's ranking**
The fastest riser this week on protocols with TVL greater than 100M and launched for more than 30 days is Beefy Finance, belonging to the Avalanche , up 152.8% in 7 days and 422.82% in 30 days.
As for fastest protocols on the major chains of this week:
● Ethereum: Synapse with a current TVL of $ 0.11B, up 84.94% in 7 days.
● BSC : Planet Finance with a current TVL of $ 0.45B and up 85.14% in 7 days.
As for fastest protocols of the major sectors of this week:
● DEX: Serum with a current TVL of $ 1.48B and up 99.96 % in 7 days.
● Lending: Larix, with a current TVL of $ 0.24B and up 62% in 7 days.
● Yield: Beefy Finance, with a current TVL of $ 0.17B, up 152.8% in 7 days.

**Overview of the week**
**I.TVL**
The overall TVL for this week was 229.32B, up 6.39% from last week.
This week's TVL ranking is Ethereum ($153.42B), with a market share of 66.9%, followed by Binance ($20.51B) and Solana ($11B).

Among the blockchains with TVL above 1 billion, the fastest riser is Avalanche with the increase of 30.84%, followed by Solana with 11.96% rise and third Waves with 11.91% rise.

In terms of categories, the first category is Dexes with a TVL of 67.63B and up 6.79 % for the week.
Among the protocols, the highest TVL was Curve ($ 15.71B ), up 7.51% for the week, and second was MakerDAO ($ 15.71B), up 12.15% for the week.

**II.Token**
The top token price this week was HBTC at $61245, up 11.32% for the week and up 28.46% in the last 30 days.
This week,the token price of the blockchain the first is ETH ($3840.96); the fastest rising is MATIC, up 11.11%, with a current amount of $ 1.5.

The top 3 Market Caps for this week's tokens are BTC, ETH, and BNB, accounting for 44.7%, 17.66%, and 3.06% of the market, respectively.

The protocols in the top 20 TVL with the lowest current MC/TVL are INST with an MC/TVL of 0.01 and the protocols are currently undervalued .Currently being the highest is UNI with an MC/TVL of 1.81. Note: MC/TVL is only one of the indicators to measure the protocol, and users also need to evaluate the agreement in the overall circumstances.
The highest priced tokens in the DEX, Lending, and Yield types this week were QUICK, INV, and YFI with the prices of $ 410.68, $780.69, and $35162, respectively.
**III.Gas**
43718 blocks used this week, down 253 blocks from last week, little change in the number of blocks used .
Total Gas fees used 77327.32 ETH this week, down 5.06% from last week; total burnt 65321.45 ETH, down 7.81% from last week. This week's choice of transaction type 2 (the use of EIP-1559 users ) accounted for 58.84%, up 0.35 percentage points from last week.

**Weekly Highlights**
Oct. 10
● Russian district court rules that 17 cryptocurrency exchange websites have illegal information, and the websites may face closure
● Metaverse project Treeverse closes seed round at $25 million valuation
● Ethereum L2 network has a TVL of $3.2 billion
Oct. 11
● TVL on Fantom surpasses $5 billion
● Algorithmic fixed-rate lending protocol Dank passes Certik security audit, to go live on Arbitrum
● Blockchain Analytics Company Elliptic Closes $60 Million Series C Funding Round
Oct. 12
● Avalanche Protocol's first cross-chain DEX HurricaneSwap mainline goes live
● Polygon launches 'Swap For Gas' to convert ETH, DAI or USDT to MATIC tokens for zero gas fees
● French Crypto Brokerage SheeldMarket Closes $10 Million Series A Funding Round Led by Atomico
● Crypto lending platform Celsius closes $400 million in funding led by WestCap and CDPQ
● Futureswap, a decentralized futures trading platform, raised $12 million in Series A funding to expand its team and grow its platform
Oct. 13
● U.S. Bitcoin Hashing Power Exceeds 35% of All Network,, Ranks #1 in the World
● Republic Launches $60 Million Crypto Seed Fund
● Bitcoin Mining Company Stronghold Digital Plans to Raise $94M to $106M in IPO
Oct. 14
● Total Value of ETH Destroyed by Ether Tops $2 Billion
● Passive Income Protocol Indexed Finance's DEFI5andCC10 Pools Attacked, Losses Reach $16 Million
● SushiSwap Completes Deployment on Celo and Partners to Launch $12.6M Liquidity Mining Bonus
● TradingView Closes $298 Million Funding Round at $3 Billion Valuation
Oct. 15
● BTC breaks $60,000 again
● CFTC demands $42.5 million in fines from Tether and Bitfinex
● Investing app Plum raises $14 million in Series A funding, plans crypto product launch in 2022
Oct. 16
● FinCEN report: More than $590 million in extortion attacks in first half of 2021, more than in all of 2020
● VC firm Tribe Capital plans to launch a $75 million crypto fund
**What is Footprint**
Footprint Analytics is an all-in-one analysis platform to visualize blockchain data and discover insights. It cleans and integrates on-chain data so users of any experience level can quickly start researching tokens, projects and protocols. With over a thousand dashboard templates plus a drag-and-drop interface, anyone can build their own customized charts in minutes. Uncover blockchain data and invest smarter with Footprint.
Footprint Website: ;
Discord: ;
Twitter:
# 6-Footprint Weekly Report: Bitcoin ETF Launched, BTC Price Reached New High

Oct, 2021,
Weekly Report Dates: October 17 - October 23, 2021([Detailed data can be found by clicking on the link](https://footprint.cool/Bw4F))
**This week's ranking**
The fastest riser this week on protocols with TVL greater than 100M and launched for more than 30 days is Yearn Finance, belonging to the Fantom , up 160.99% in 7 days and 2566.48% in 30 days.
As for fastest protocols on the major chains of this week:
● Ethereum: KeeperDAO with a current TVL of $ 0.43B, up 79.88% in 7 days.
● BSC : Qubi with a current TVL of $ 0.46B and up 22.02% in 7 days.
As for fastest protocols of the major sectors of this week:
● DEX: Trader Joe with a current TVL of $ 2.34B and up 99.96 % in 7 days.
● Lending: Abracadabra, with a current TVL of $ 0.16B and up 124.8% in7 days.
● Yield: Yearn Finance, with a current TVL of $ 0.16B, up 160.99% in 7 days.

**Overview of the week**
**I.TVL**
The overall TVL for this week was 239.17B, up 3.77% from last week.
This week's TVL ranking is Ethereum ($158.32B), with a market share of 66.2%, followed by Binance ($21.55B) and Solana ($12.66B).

Among the blockchains with TVL above 1 billion, the fastest riser is Tron with the increase of 333.81%, followed by Avalanche with 113.21% rise and third Terra with 11.53% rise.

In terms of categories, the first category is Dexes with a TVL of 70.33B and up 3.95% for the week.
Among the protocols, the highest TVL was MakerDAO ($ 16.11B ), up 5.51% for the week, and second was Curve ($ 16.11B), up 2.31% for the week.

**II.Token**
The top token price this week was BTC at $62392, up 7.1% for the week and up 38% in the last 30 days.
This week,the token price of the blockchain, the first is ETH ($4177.25); the fastest rising is SOL, up 25.06%, with a current amount of $ 198.25.

The top 3 Market Caps for this week's tokens are BTC, ETH, and BNB, accounting for 43.42%、18.44% and 3.06% of the market, respectively.

The protocols in the top 20 TVL with the lowest current MC/TVL are INST with an MC/TVL of 0.01 and the protocols are currently undervalued .Currently being the highest is UNI with an MC/TVL of 1.74. Note: MC/TVL is only one of the indicators to measure the protocol, and users also need to evaluate the agreement in the overall circumstances.
The highest priced tokens in the DEX, Lending, and Yield types this week were QUICK, INV, and YFI with the prices of $ 410.68, $780.69, and $35162, respectively.
**III.Gas**
44001 blocks used this week, down 283 blocks from last week, little change in the number of blocks used .
Total Gas fees used 62782.22 ETH this week, down 18.81% from last week; total burnt 51504.68 ETH, down 21.15% from last week. This week's choice of transaction type 2 (the use of EIP-1559 users ) accounted for 58.37%, up 0.48 percentage points from last week.

**Weekly Highlights**
Oct. 17
● Sotheby's sets £2.072 million auction record for FEWOCiOUS' physical and NFT diptych artwork
● ECB President: monetary policy will continue to support the economy
Oct. 18
● Grayscale Plans to Apply to Convert Bitcoin Funds to Spot ETs
● Binance Smart Chain Tops 100 Million Unique Addresses
● 100 Million Unique Addresses on Polygon
● Total cryptocurrency market cap tops $2.6 trillion, a record high
Oct. 19
● Grayscale Officially Confirms Plans to File Bitcoin Spot ETF Application
● DeFi protocol Glide Finance contract vulnerability was exploited, the loss amount is about $300,000
● Stablecoin Protocol Terra Partners with Abracadabra, a Stablecoin Protocol for Interest Bearing Assets, to Compete with Centralized Stablecoins
● Gadze Finance Launches $25 Million DeFi Cryptocurrency Fund
Oct. 20
● Facebook Begins Piloting Its Crypto Wallet Novi in the U.S.
● Metaverse Platform Cryptovoxels Now Supports Facebook Account Login
● ProShares Bitcoin futures ETF traded nearly $1 billion on its first day, up about 4.9%
Oct. 21
● BTC Breaks $66,900, Hits Record High
● TLV on Ether Tops $100 Billion
● UK Crypto Startup Copper Plans to Raise Up to $500 Million in Funding
● Tesla: Did Not Sell or Buy Bitcoin Again in Q3, Holds $1.26bn Worth of BTC Oct. 22
● Stablecoin DAI Issuance Tops $7 Billion, Hits Record High
● Bitcoin Lightning Network Capacity Tops $200 Million
● About 3,000 DApps already on Polygon, 62% are deployed only on Polygon
● NFT: Candy Digital Closes $100M Series A Funding Round at $1.5B Valuation
Oct. 23
● Shenzhen Launches New Round of Digital RMB Bonus Campaign Individuals Can Receive Up to 520 RMB
● Valkyrie Bitcoin Futures ETF has been listed for trading on Nasdaq, opening at $25.50 with nearly $80 million in trading volume
**What is Footprint**
Footprint Analytics is an all-in-one analysis platform to visualize blockchain data and discover insights. It cleans and integrates on-chain data so users of any experience level can quickly start researching tokens, projects and protocols. With over a thousand dashboard templates plus a drag-and-drop interface, anyone can build their own customized charts in minutes. Uncover blockchain data and invest smarter with Footprint.
Footprint Website: Discord: Twitter:
# Footprint介绍
Footprint——一站式可视化数据分析平台

Footprint是一个一站式可视化区块链数据分析平台。
Footprint将用户体验放在第一位,它提供了一个直观简洁的用户界面,可以通过拖拽式数据交互,进行查询和可视化数据分析。无论是数据分析师、数据科学家、开发人员、学生、教师、管理者还是项目方,都可以迎合自己的需求,轻松使用这一强大的数据分析工具。
# Official Links
Know more about Footprint
#### 请通过以下方式联系我们,你可以
✔反馈问题
✔提出建议
✔寻求合作
`官网:`[`https://www.footprint.network/`](https://www.footprint.network/)
`推特:`[`https://twitter.com/Footprint_DeFi`](https://twitter.com/Footprint_DeFi)
`Discord:`[`https://discord.com/invite/3HYaR6USM7`](https://discord.com/invite/3HYaR6USM7)
`Medium:`[`https://medium.com/@footprintofficial`](https://medium.com/@footprintofficial)
`Telegram:`[`https://t.me/joinchat/4-ocuURAr2thODFh`](https://t.me/joinchat/4-ocuURAr2thODFh)
# 1-寻找下一个DeFi爆发点,链上数据还能带给我们什么洞察?
# 1-Footprint: SushiSwap能追上Uniswap吗?
撰文:Footprint分析师Simon\
日期:2021/7
虽然Sushiswap 2020 年 8 月才上线,但其各方面都势头正猛,逐步成为Uniswap的强劲对手。本文将从TVL、交易量、币价、市值4个维度对比两个平台的表现。
**TVL**
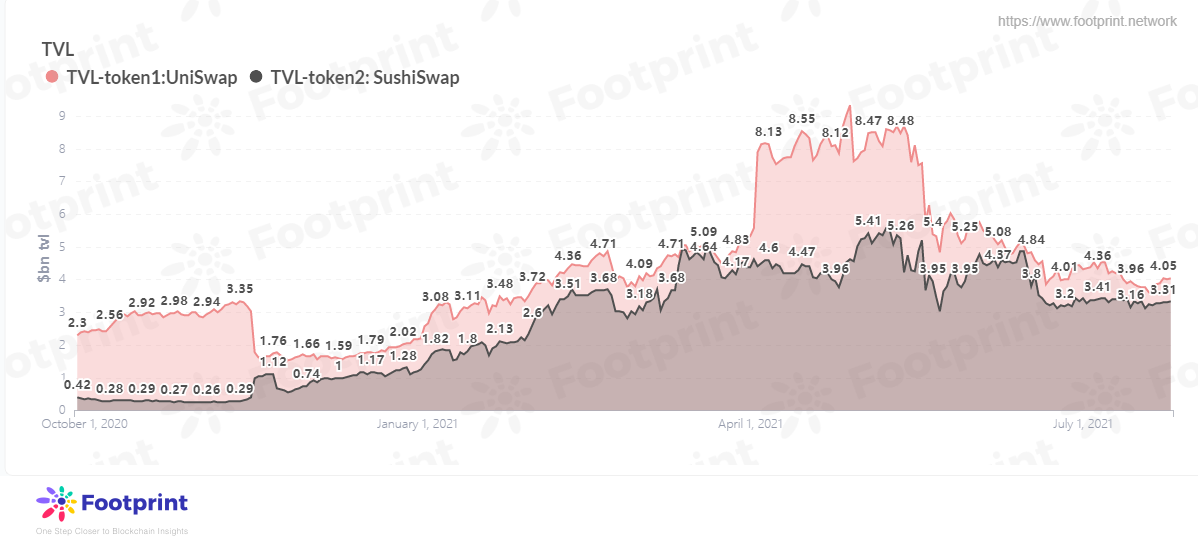
从2020年10月开始,Sushiswap开始发力,有逐步赶超Uniswap的势头,虽然今年4到5月未能跟上Uniswap的涨势,但仍稳步上升。
5月末各国政府出台对加密货币收紧的政策,致使加密货币暴跌,市场惨遭重创。在此之后,Uniswap与Sushiswap的距离逐步缩小,截止到7月25日,Uniswap和Sushiswap的TVL仅相差17.5%。
**Volume**

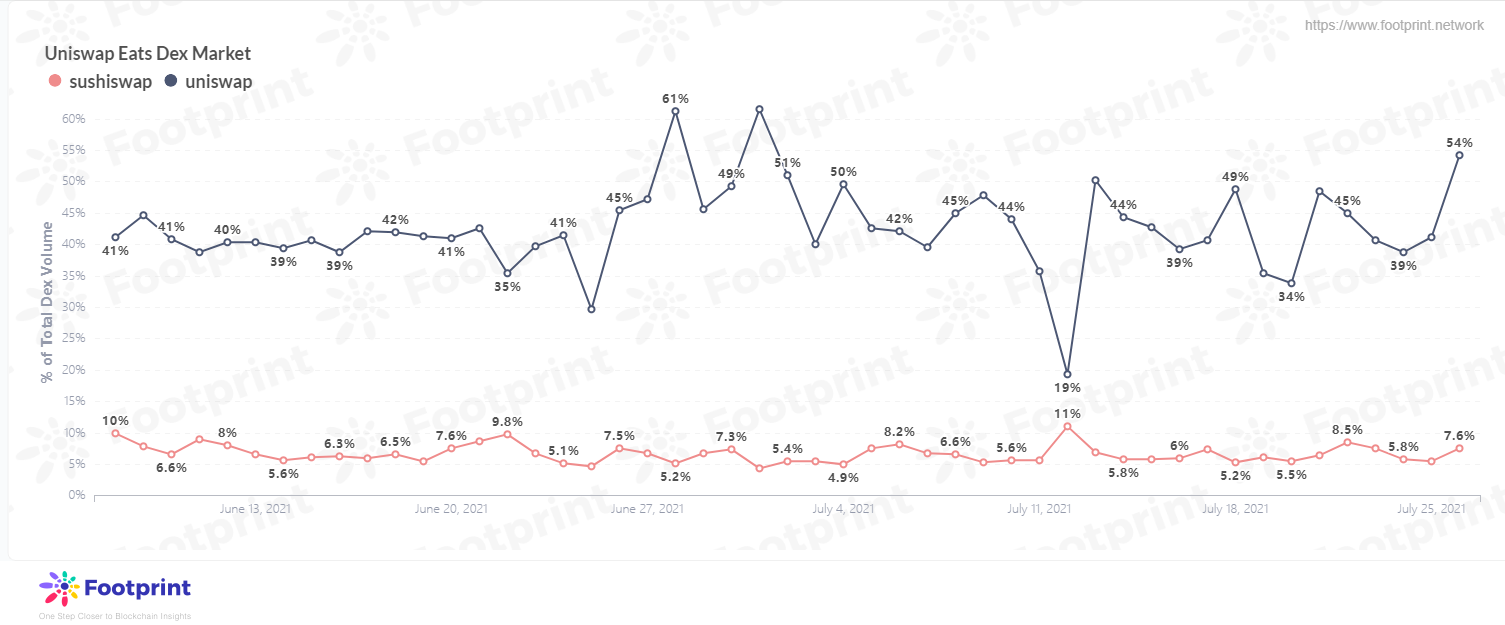
Uniswap仍在所有 DEX 交易量中占比 40% 左右,与Sushi的不足10%拉开了较大的差距。
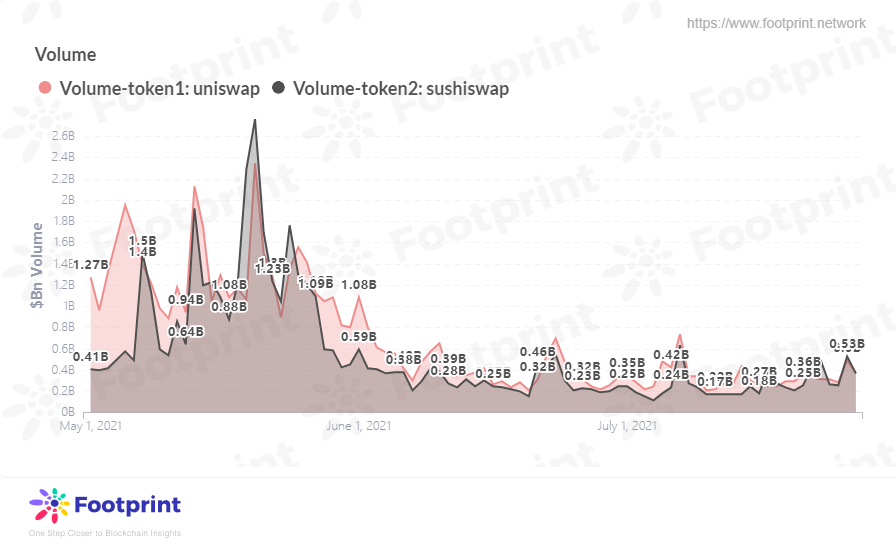
但从Token的volume来看,SUSHI的交易量自5月后有逐步超过UNI的趋势,2个代币的差距逐渐缩小。DEX 代币的交易量是衡量去中心化交易的一个基本指标,更高的交易量意味着协议产生更多的费用收入,这会推动这些 DeFi 代币的价值。
**Price**
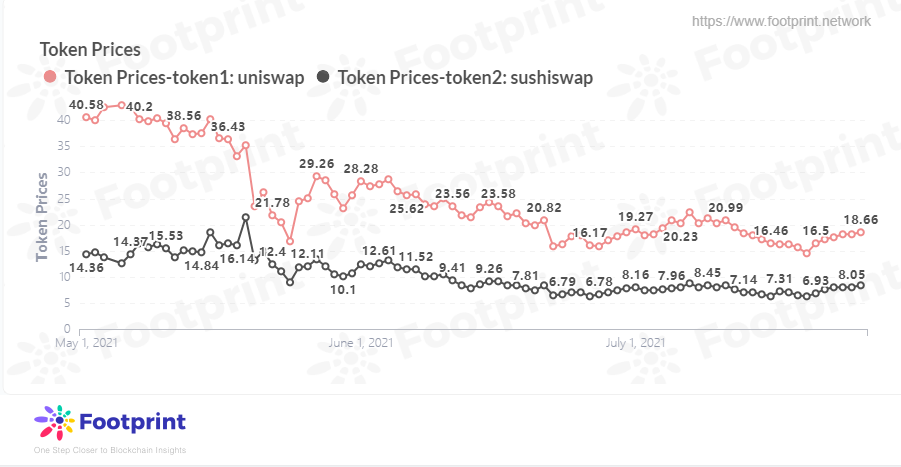
SUSHI 目前价格在 8 美元左右,而UNI目前在18美元左右。值得注意的是,SUSHI 持有者可选择质押他们的代币并获得 xSUSHI,以此获取 Sushiswap 产生的所有费用的 16.6%。虽然 UNI 不具 此功能,但它的表现仍然优于 SUSHI。
**Market Cap**

市值为代币当前价格与流通量的乘积。由于流通量的因素加上目前SUSHI价格与UNI的较大差距,两者差距还有6倍之多。
总体来看,上线还不足1年的Sushiswap虽然距离Uniswap还有一些距离,但从价格等指标来看,SUSHI是在越来强了。Sushi 最初可能是 Uniswap V2 的一个分支,但现在它在逐步演变成一个新的 DeFi 项目。
# 2-2021Q2稳定币趋势,USDT还能持续稳定币龙头地位吗?
撰文:Footprint分析师Bella\
日期:2021/7/28
稳定币作为加密货币市场重要的媒介,2021年,稳定币市值持续增长。USDT作为最常用的稳定币,在交易市场处于龙头地位,USDC,DAI等稳定币也凭借其更合规,与DeFi场景紧密结合的优势,逐步赢得稳定币更高的市场份额。 本报告主要围绕当前排名前9的稳定币,从market cap, transaction volume维度对该9种稳定币进行展开分析。\
\
稳定币的Market Cap 在2021年第2季度阶段保持快速上涨趋势,与季末到达1070亿。 相较2021年第1季度的620亿上升了450亿,涨幅高达72.5% 。 其中BUSD的涨幅最为明显,紧随其后的为USDC、DAI、GUSD。

**1.USDT在第2季度稳定币市场份额中继续占据主导位置,比例高达58.8%**
随着加密货币市场的不断发展与完善,更合规与更安全的加密货币成为越来越多DeFi 用户与项目方的首选。而USDC却凭借其合规性,在第2季度中脱颖而出,不断扩大其在稳定币市场的份额的同时逐渐削弱USDT的龙头地位,并稳定币市场发挥越来越重要的作用。据Footprint数据统计,USDC市场份额从第1季度的17.5%扩大到23.7% , USDT市场份额从65.9%缩减到到58.8%。
按照USDC第2季度的增长速率,预计在2021年年末到2022年年初,USDC就能与USDT占有相同比例的市场份额甚至超过USDT。

**2.去中心化稳定币上涨幅度超过中心化稳定币,是中心化稳定币的1.4倍**
中心化稳定币在Market Cap中持续占据主要地位,较年初上涨290%,而去中心化稳定币较年初上涨400%,主要归功于DAI在本年度创造350%领跑涨幅,从而使得去中心化稳定币在稳定币市场的占比逐步提升。
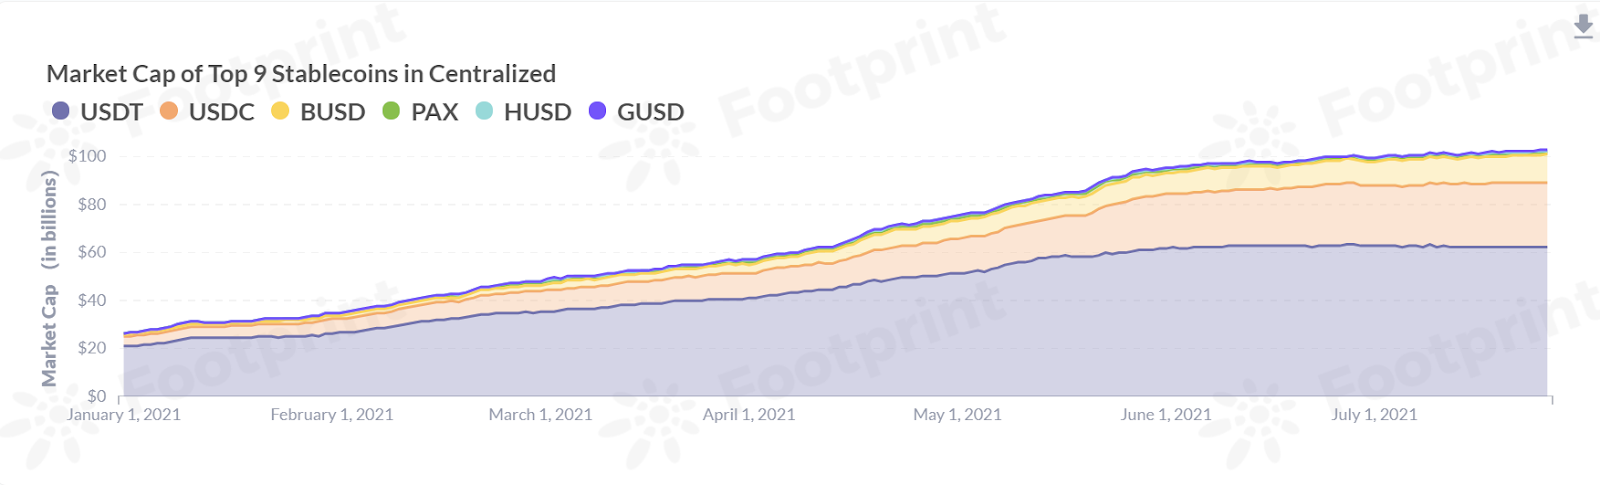

**3.稳定币交易量于5月到达高峰**
随着越来越多的新兴DeFi项目的涌现,项目方为保持平台较高的流动性,一般会推出使用稳定币参与流动性挖矿的活动,这使得稳定币的使用范围不断扩大,交易量也不断创新高。据Footprint数据统计,稳定币交易量在第2季度持续上升,并于5月达到最高峰。
但受新一轮全球监管风暴影响,5 月 19 日加密市场遭遇了史上最大规模的暴跌,稳定币的交易量持续下降甚至回到2021年初水平。

**4.DAI在去中心化稳定币交易量中占主导位置**
据Footprint数据统计,受5月币价下跌的影响,中心化稳定币与去中心化稳定币交易量都受到不同程度的冲击。由于Defi借贷市场的快速发展,DAI已经逐渐成为各大数字资产在借贷平台流通的硬通货,并在前三大借贷平台的中占据一半江山,因此DAI的交易量在币价下跌的情况下能维持4月水平,发挥其在去中心化稳定币的主导地位。


**小结**
加密市场逐渐发展,稳定币正在加密市场发挥更大的作用。不同的稳定币应用场景也在逐步清晰。USDT虽然其存在储备金不够明等合规问题,但目前在中心化交易所,作为交易和转账的媒介,仍是用户使用最高频的稳定币。而USDC则凭借其合规性在DeFi领域站稳脚跟,随着DeFi项目喷涌式的发展,USDC或将在不久后超越USDT,成为交易量最大的稳定币。其他稳定币如果像DAI一样,找到其相关的应用场景,相信也可以有更好的发展。
# 3-纵览DEX上半年发展:公链发展迅速,谁能坐稳DEX龙头
撰文:Footprint分析师Simon\
日期:2021/8
随着公链性能的提升,DeFi世界中正在崛起的重要基础设施DEX在2021年的也展示了强劲的增长能力。自动做市商(AMM)让用户无需中介即可在加密资产之间进行兑换。DEX赛道中不断涌现出更多的竞争者,本文主要从以太坊和币安智能链的数据出发,从以下4个角度对目前DEX的发展进行一个较宏观的比较。
### 1.交易量
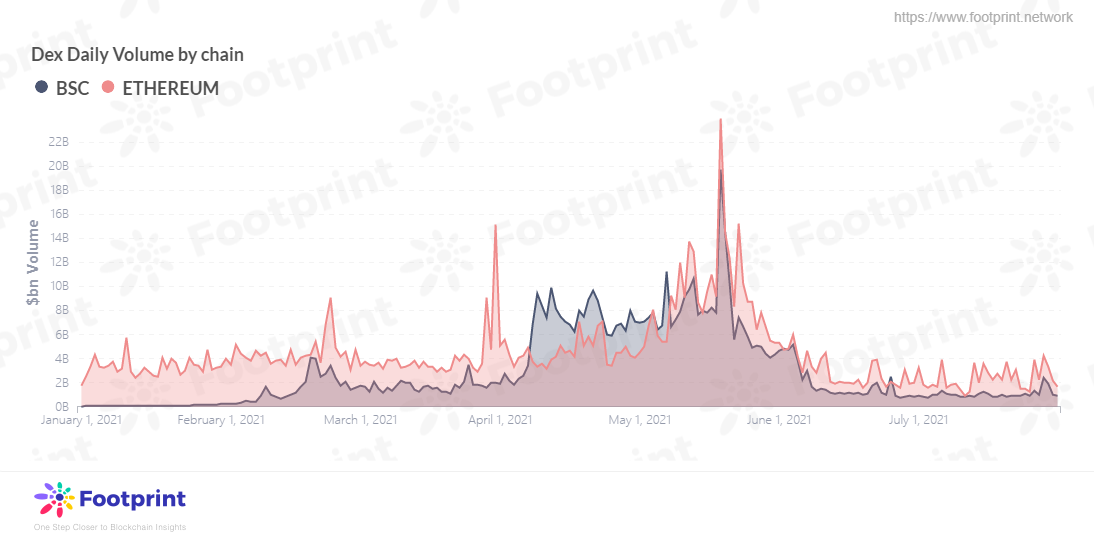
DEX一直是以太坊上的主要的应用,随着DeFi项目的兴起,从今年3月开始整个DEX项目的交易量也快速上涨,5月末实现了翻倍的增长。DEX快速增长同时也引起了监管的重视,随着各国陆续发布的区块链政策,部分看空的声音也对DeFi产生负面影响,DEX的交易量在5月后迅速下降,但与2020年相比仍是突破性的增长。

DeFi的高速发展使得以太坊上拥堵的现象更加明显,随之高涨的Gas费也被市场进一步放大。此时的币安智能链凭借相对较低的Gas费发力赶超,从Footprint上的统计数据观察到,在交易量上币安智能链从今年2月开始逐渐上升,在市场份额上二季度甚至一度超过以太坊。
但以太坊上的Defi项目仍占主导地位,Uniswap V3 于7月在 Optimistic Ethereum 主网上启动 Alpha 版本,同时随着Layer2方案落地以太坊上的拥堵情况逐步得到改善,在交易量上以太坊又重新找回市场份额。
2021年8月5日,以太坊EIP-1559完成硬分叉升级,提案中包含交易费销毁等众多好处是否会对以太坊的市场份额有进一步的提升近期便会揭晓答案。


以太坊上拥有较多的DEX平台,以Uniswap、Sushiswap、Curve等为代表,在以太坊上占比最高的Uniswap在两条链上交易量的占比甚至也近50%。从Footprint的数据上来看,Uniswap V3 的交易量已经是 V2 的两倍以上,V3上线以来的表现相当突出。
而币安智能链上主要以PancakeSwap和MDEX为主,值得注意的是PancakeSwap在币安智能链上的发展成为了Uniswap的强劲对手,从2月开始不断侵占市场份额,在4月达到了巅峰,但随着Uniswap升级到了V3,5月后币安智能链也出现不少问题,PancakeSwap的市场份额又重新被挤压下来,Uniswap的市场份额重回50%,同时Sushiswap也引进了bentobox,以太坊和币安智能链的竞争还在胶着着,到底谁能吃下DEX这个蛋糕可以拭目以待。
### 2.代币价格

Footprint上的数据显示,从今年开始,大部分Dex平台的代币今年5月以前都保持着上升趋势,其中PancakeSwap的代币Cake上升的最为明显,在5月一度赶超UNI,还重新引发了币安智能链的强势,平台与链做到了互相成就。虽然6月后各平台币价都大跳水,但作为以太坊和币安智能链的头部平台Uniswap和PancakeSwap仍引领高位。
Sushiswap作为同在以太坊上的DEX常常会与Uniswap比较,虽然SUSHI 持有者可以质押他们的代币换取 xSUSHI,从而获得 Sushiswap 交易费用,但从币价来看显然市场还是更加看好UNI。
### 3.Gas费

在链上的任何操作都需要消耗不定的Gas费,这主要取决于需要执行的操作所需的工作量,目前与代币兑换相关的合约是消耗区块链资源最多的合约之一,因此DEX占据了链上Gas消耗的大部分。
通过Footprint统计,在上个月Dex发行的代币中,转换成UNI所产生的费用最多,进一步体现了市场对Uniswap的看好。
### 4.交易对

7月在DEX平台上前50交易量最多的交易对为ETH/USDC,其次为USDC/ETH,可以看出主要的交易对还是围绕在稳定币与ETH之间,虽然各平台纷纷发行自己的代币,但市场更认可的还是稳定币和ETH。

币安智能链上的主要交易对同样是稳定币与WBNB,除此之外以WBNB为锚定的交易对中Cake占比最高。

从每日有发生交易的交易对数量来看,PancakeSwap于今年3月在数量上反超Uniswap,目前每日数量已达2万以上,而Uniswap的数量一直都保持稳定,Sushiswap的数量则属垫底,可以看出PancakeSwap似乎更想从广度上取胜。
从Footprint上统计出7月整月有发生过交易的交易对个数Sushiswap 只有1750 个,而 Uniswap V2有16534个,Uniswap V3 有3386 个,而PancakeSwap7月的交易对有135278个。
但近期美国证券交易委员会(SEC)和商品期货交易委员会(CFTC)加强了对交易所代币的审查,Uniswap在 7 月 末表示鉴于「不断变化的监管环境」宣布切断接口,限制对超过 100 种代币的访问。
限制的代币完整列表:
**总结**
DEX平台在今年上半年迎来飞速增加后,虽受到监管等各方面的影响数据受到重创,但以Uniswap、Sushiswap和PancakeSwap为首的DEX平台依旧表现出众,在SushiSwap在上半年疯狂侵蚀市场,而以太坊和币安智能链的竞争也在继续,币安智能链上更有优势的Gas费和强势而来的PancakeSwap,以太坊通过EIP-1559是否能拉开领先优势今年下半年可以一同期待。
# 4-Footprint:EIP-1559升级后到底谁才是受益方?
_%E6%9E%81%E9%80%9F%E7%9C%8B%E5%9B%BE%20\(1\).jpg?alt=media\&token=ce8f608a-6eb7-44a3-9d80-fa69054346f0)
撰文:Simon\@Footprint
日期:2021年8月
2021年8月5日(12:33:42 PM +UTC),在以太坊区块高度12,965,000 时激活了第十一次硬分叉伦敦升级,本次升级为近几年最为重要的一次。升级的第一个区块销毁了0.030025257 Ether,成为历史性的一刻。

伦敦升级包括了5项社区提案(EIP),分别是EIP-1559、EIP-3198、EIP-3529、EIP-3541 和 EIP-3554,其中最受关注的无非就是EIP-1559,它使以太坊的交易费机制发生了颠覆性的改变。
虽然EIP-1559 早在 2019 年 4 月已被提出,但直到2021年的伦敦升级才最终落地,主要由于其中涉及到了不同主体的利益。
**升级前:**
以太坊上交易采取的是拍卖模式,由于信息的不对称,用户无法预测自己需支付多少费用才能使自己的交易尽快被处理,因此可能会支付较高的交易费用,而矿工的收益来源于用户交易中支付的Gas费以及区块奖励和叔快奖励,往往会优先处理支付更高Gas费用的交易。
当链上交易发生拥堵时,用户支付的Gas费更加水涨船高。随着链上DApp的不断发展,以太坊上高波动的Gas费,以及过长的确认交易时间,交易的低效率都让很多用户望而却步,甚至转去了币安智能链。
**升级后:**
EIP-1559主要从两方面优化升级前的问题:
1.费用分配机制
EIP-1559把之前一整笔给矿工的费用,即Transaction Fee(以下简称Gas Fee)分为两个部分:
* 基础费(Base Fee, 也称作 Burnt Fee)\
根据上一个区块的基础费和区块利用率计算而来,是用户无法自行调节必须支付的费用,当上一个区块利用率高于50%时,基础费会上升,反之费用下降。这部分费用同时还有个最让人争议的机制,即销毁机制,从而改变了ETH的货币政策。
* 优先费(Priority fee)\
由用户选择性支付,该费用直接支付给矿工,对于想要加快交易速度的用户同样可以设置高额度来吸引矿工。但当交易高峰时,通过不断提高优先费而促成交易的行为似乎又回到了升级前的拍卖模式,只是升级后的基础费更可预测。
2.区块的松弛机制
在面对突然激增的交易需求时,EIP-1559允许区块的大小可变,目标Gas的使用量是Gas上线的50%,当上升时基础费同样会上升,这些机制使得Gas价格可以更加平稳。
**EIP-1559升级后到底谁会是最终受益方?**
EIP-1559上线后受到了大量的讨论,以太坊也因此得到了前所未有的关注,对于此次升级各方声音不断,各种分析也层出不穷,下面将使用[Footprint](https://www.footprint.network/dashboard/160?date=past6months~)(可以通过点击此处了解详细数据)的数据具体分析一下伦敦升级后以太坊Gas费方面的具体表现。

在升级前很多声音表示未来的Gas费会降低,但到截稿日期前(2021年8月17日),从Footprint的数据来看,升级后每日用户支付的总Gas费约6100 ETH,每日销毁的基础费约4500ETH,较升级前2个月并没有明显降低,反而有略微的上升趋势,基础费反而跟升级前的Gas费用更接近,但用户在此基础上还要支付额外的优先费。

总交易费用可能会受到交易数量的影响,可以从平均的Gas费价格和基础费价格来看,仍能看到升级后的平均Gas费价格相对于升级前是上升的。
因此,从目前的数据来看,EIP-1559并不能使Gas费变得更低,对用户来说反而比之前承担了更多的Gas费,如果此时ETH价格上升,用户实际支付的费用会进一步增加,但升级后Gas费的变动情况目前看来确实比比升级前更加的稳定了。

虽然Gas费并没有很明显的降低,但从数据上看来,用户可以尽量避开高峰时段,一般一天中的19点(UTC+0)是交易高峰,价格处于最高点,平均Gas的价格甚至会去到98GWei,其次可以尽量避开16点到23点的时间进行交易,绕开Gas费较高的时间段。
对于用户来说,种种数据表明并没有减轻交易费用,那么对于矿工来说又带来了怎么样的改变呢?

在2021年8月5日升级后,矿工除了获得区块给予的奖励外,从用户处直接获得的收益就只有优先费,相对于用户付出的总交易费来说,虽然优先费只占了很小的一部分,但从Footprint的数据来看,相比于升级前每日矿工的总收益并没有减少很多。截止发稿日,平均每个区块用户支付了0.99ETH,其中销毁掉0.73ETH的基础费,矿工将收到0.27ETH的优先费。\

从基础费和优先费的占比来看,目前交易费用中,用户大概有20%左右是支付给矿工的优先费,这也意味着每笔交易中,会有80%的费用被销毁掉。截止到发稿日,大约已有59,8TH被销毁掉,近24小时平均每分钟会销毁2.91ETH,不到一个月ETH的销毁量就有如此惊人的数量,在一定程度上必然是可以抑制ETH的通货膨胀,从而刺激ETH币价上升。值得关注的是,目前销毁掉最多基础费的前三的项目依次是OpenSea、Uniswap和Axie Infinity。

最后来看一下目前ETH的价格,截止至发稿日价格为3063美元,目前看来自升级后总体还是上升趋势,结合以上的数据看到矿工的每日优先费并没有较明显的下跌,矿工的收益从长远来说并不一定会受到影响。对于单纯的ETH持有者来说必然是利好的,但从用户的角度来看,就没这么友好了,并没有如预期的减少交易费用,反而略有上升,再加上销毁机制使得ETH币价的上升,对用户来说可以说似乎造成了双重负担。
Footprint官网:
Discord社群:
微信公众号:Footprint区块链分析 (FootprintDeFi)
Footprint是一个一站式可视化区块链数据分析平台。
Footprint将用户体验放在第一位,它提供了一个直观简洁的用户界面,可以通过拖拽式数据交互,进行查询和可视化数据分析。无论是数据分析师、数据科学家、开发人员、学生、教师、管理者还是项目方,都可以迎合自己的需求,轻松使用这一强大的数据分析工具。
# 5-变化之大,谁将是借贷类平台的王者

撰文:Footprint 分析师
日期:2021/8/17
随着用户对借贷需求趋于旺盛,借贷类DeFi的发展可以说非常迅猛,平台之间的竞争也异常激烈,而5月币价的大跌,对头部借贷类平台来说是一个重新洗牌的过程。当前距离5月币价的下跌,已过去两个多月,下面我们通过多指标进行分析评估,当前头部的借贷平台Aave、Compound与MakerDAO谁将成为借贷类平台之王。
1. **TVL**
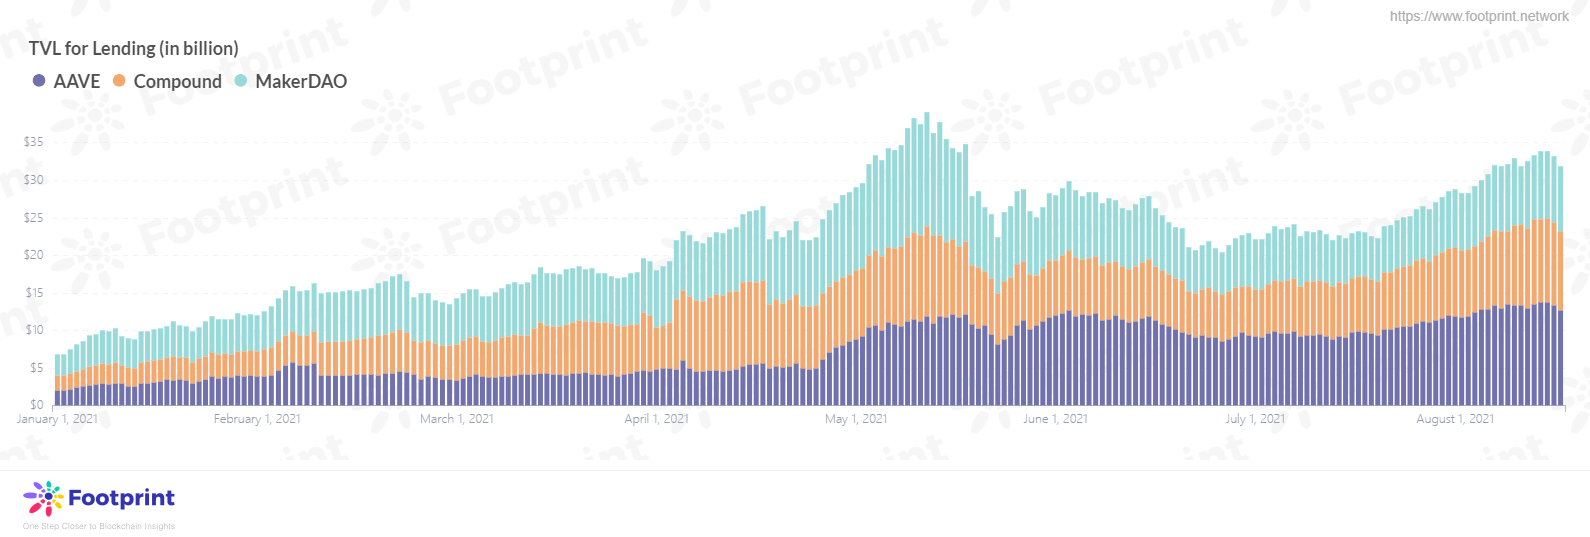
**Lending类平台快速发展,Aave已超过MakerDao**
Lending类平台在2021年迎来了高速的发展期,虽然在5月出现了小波折,让发展速度有所减缓,却没有影响发展的势头。年初头部前三大借贷类平台的TVL总量为68.8亿美金,随后持续增长,4月底5月中迎来了一个小高潮,到5月12日TVL已达到为390.6亿美金,创历史新高。从年初到5月12日的高峰,仅用时5个月,TVL总量已经翻了5.67倍,增长率高达467.7%。
受5月币价大跌事件的影响,TVL总量恢复到4月的水平,并于5月23日产生该事件影响的最低位,降幅高达42.7%,虽在6月底还有一些波动,到7月末Aave已超过MakerDao,并突破5月创造的峰值。在8月开始,各平台发展势头强劲,特别是Aave,截止发稿前TVL高达133.5亿美金,是当前DeFi应用里TVL最高的平台。
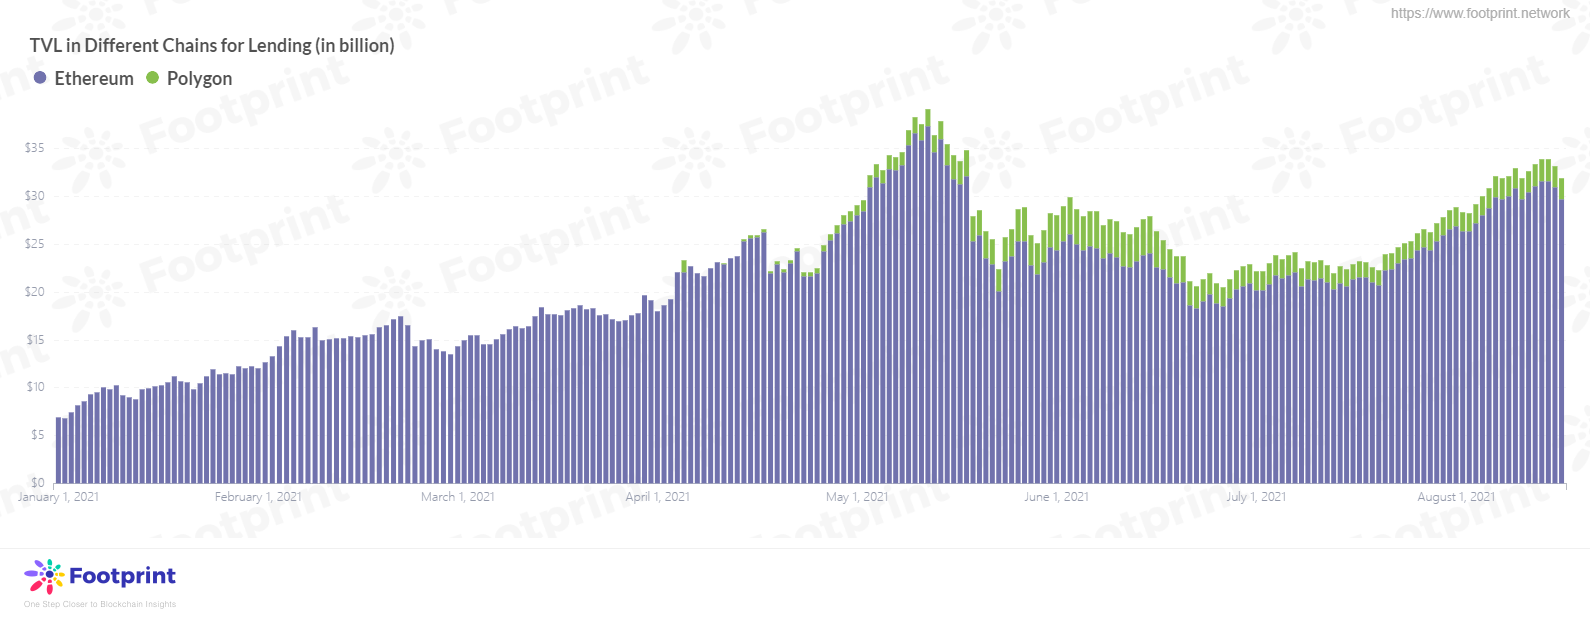
**Aave跨链部署,助其位居第一**
为降低以太坊链交易拥堵、交易费用高不利于用户进行交易的体验,Aave先发尝试将其部署在与以太链具有相似使用体验但交易成本更低的Polygon链上,该举措无疑吸引更多活跃在Polygon链的受众,也吸引更多首次接触借贷类交易的新手用户。
4月,Aave完成其在Polygon链的部署,随后在Polygon链的TVL量逐渐提高,仅仅经过两个多月,已实现从0到38亿美金的突破,占整个Polygon链TVL的76%,该成绩也为Aave在6月实现超越MakerDAO位居借贷类平台第一以及位居DeFi TVL排行榜第一位的双赢局面作出较大贡献。
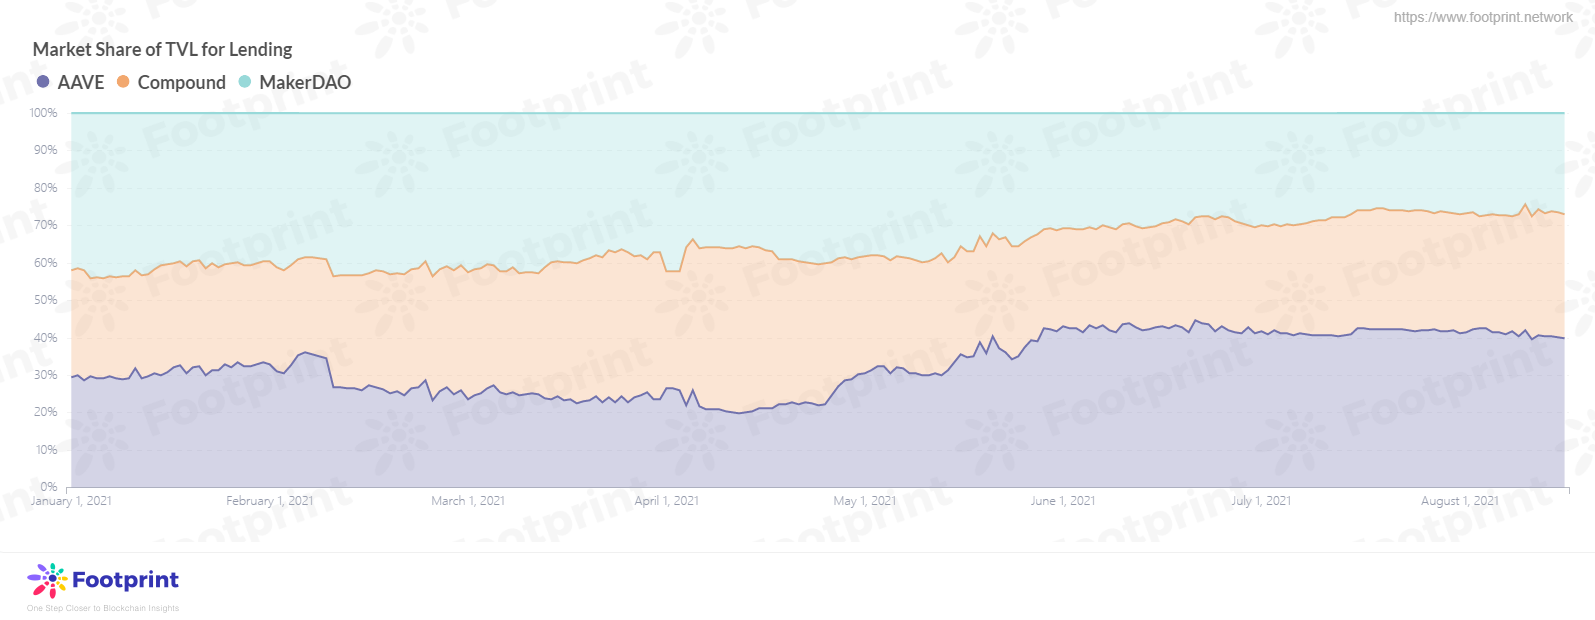
**借贷类头部平台竞争激烈,Aave超越Compound和MakerDAO**
从Footprint Analytics提供的TVL市场份额数据,本年度占据市场份额首位的平台竞争较为激烈。1-3月位居首位的为MakerDAO,该期间MarkeDAO的TVL占市场份额的40%-43%;4月开始,随着Compound的代币价格再次快速上涨,其凭借首创的“借贷挖矿”模式,给存款人与借款人提供挖矿补贴,增加存款人收益同时也降低借款人的借款利率,吸引更多用户量,不断侵蚀MakerDAO和Aave的的市场份额,回归首位;随后由于Aave也启用自身平台的流动性挖矿计划和布局跨链,借贷平台的资本再次发生转移,Compound逐渐失去其市场份额,Aave实现反超,截止发稿前,Aave的市场份额约占42%。
**2. 资金存量**
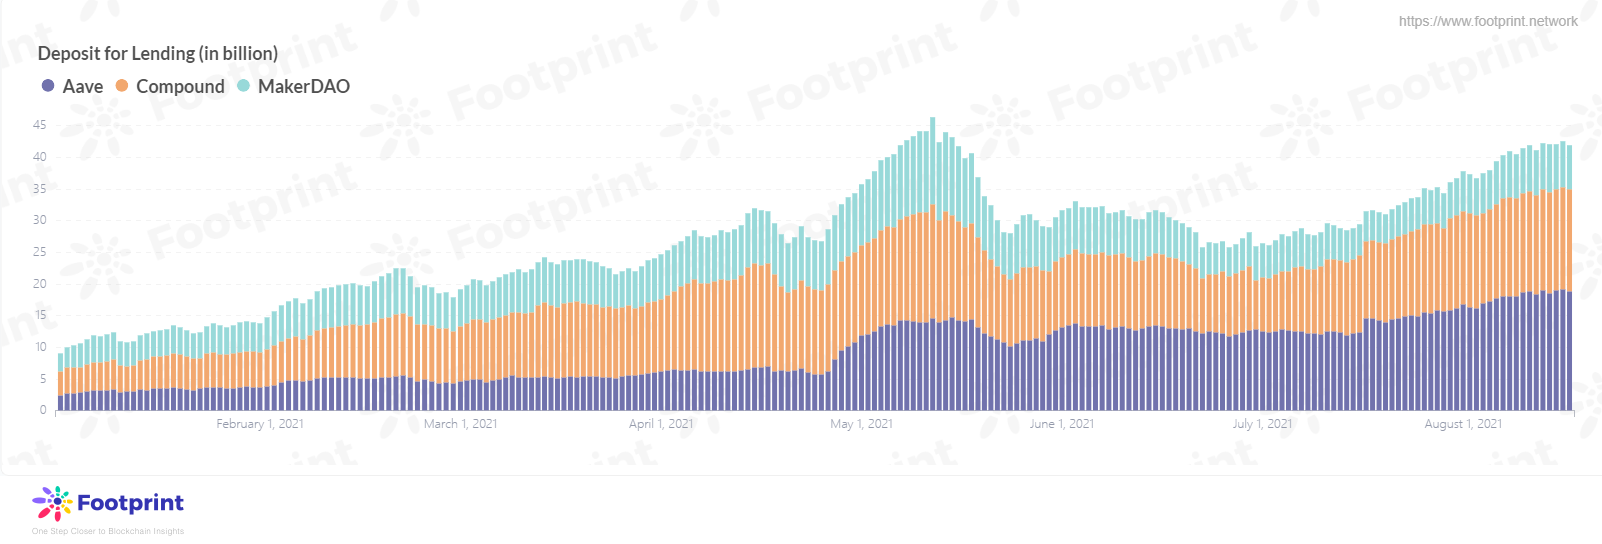
**相较年初,Aave增长567.6%,Compound增长299.5%,MakerDAO增长112.9%**
对借贷平台来说,在余资金存入量(Deposit)是评估一个平台能力的关键指标,该指标除了影响平台的锁仓量,还影响可供出借的资金量。随着借贷类平台形式多样化发展,安全性与合规性的逐步提高,存入借贷类平台进行赚取收益的用户量以及资金量不断增长,相较年初的88.9亿美金,7月末Deposit量已高达367.5亿美金,是年初的4.13倍,其中MakerDAO因只专注于稳定币DAI的借贷相较年初增长率仅有112.9%,远低于平均水平;Compound因主打借贷挖矿,当年增长率为299.5%,高于MakerDAO,该增长率主要受限与上架资产种类较少,截止发稿前只有15种资产;而Aave因其业务类型广(含浮动利率借贷、固定利率借贷、AMM贷款市场、闪电贷、信用额度委托等) 、上架资产种类多(高达28种)和上线流动性挖矿给予用户补贴,当年增长率高达567.6%。
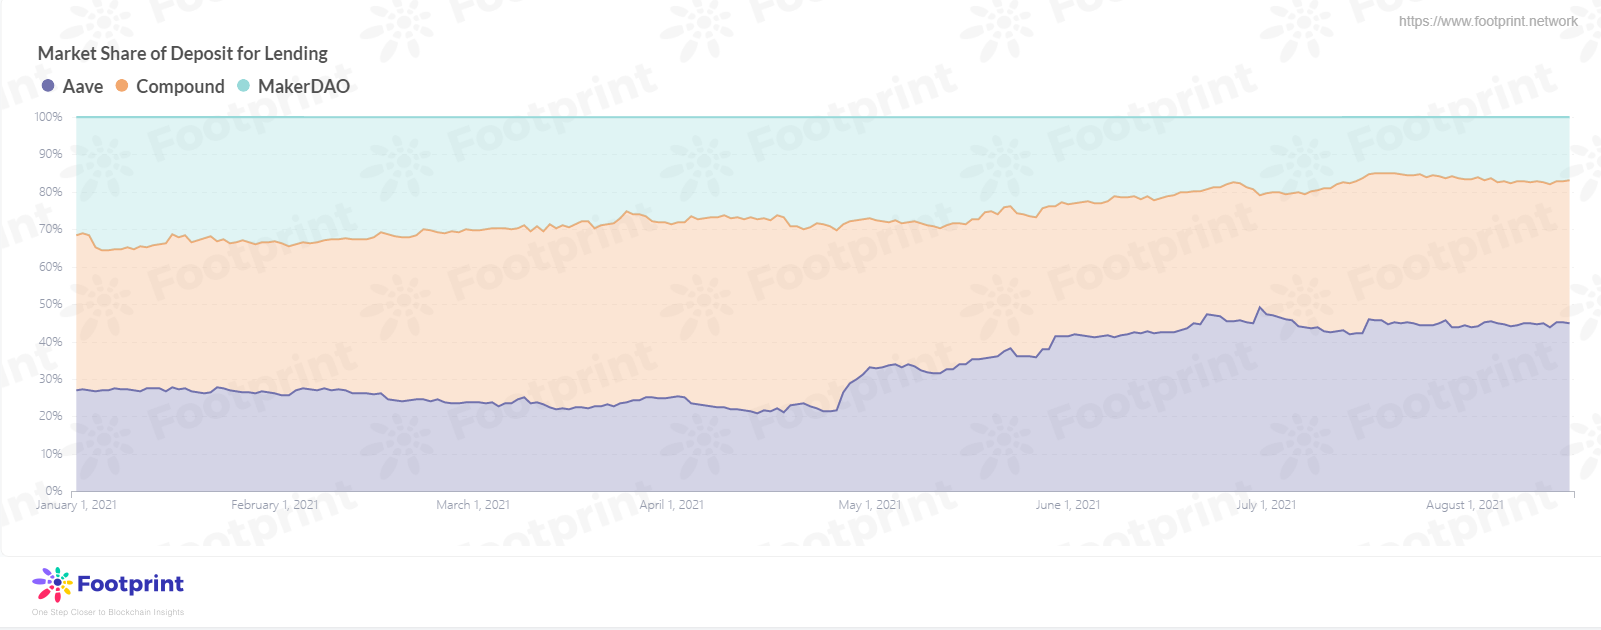
**发展模式持续创新的平台对存量资金占有量持续提升**
回看今年近7个月以来Deposit市场份额的变化趋势,保持相较稳定的为Compound,维持37%-40%左右的份额,虽其在4月有扩大的趋势,高峰时高达48.5%,但后续由于Aave的新模式吸入更多存入资金,所占市场份额回到原来水平。而反观Aave与MakerDAO对市场份额的分割变化较大,Aave不断侵蚀MakerDAO的市场份额,份额从年初的仅占据27%到7月已占据45%,并有继续扩大的趋势,可见Aave的不断创新、不断优化、不断迭代对该平台的发展发挥巨大作用。而MakerDAO由于专注做稳定币的借贷,在发展模式上没有过多更新迭代,市场份额被逐渐占据缩小。
**3. 在贷余额表现**
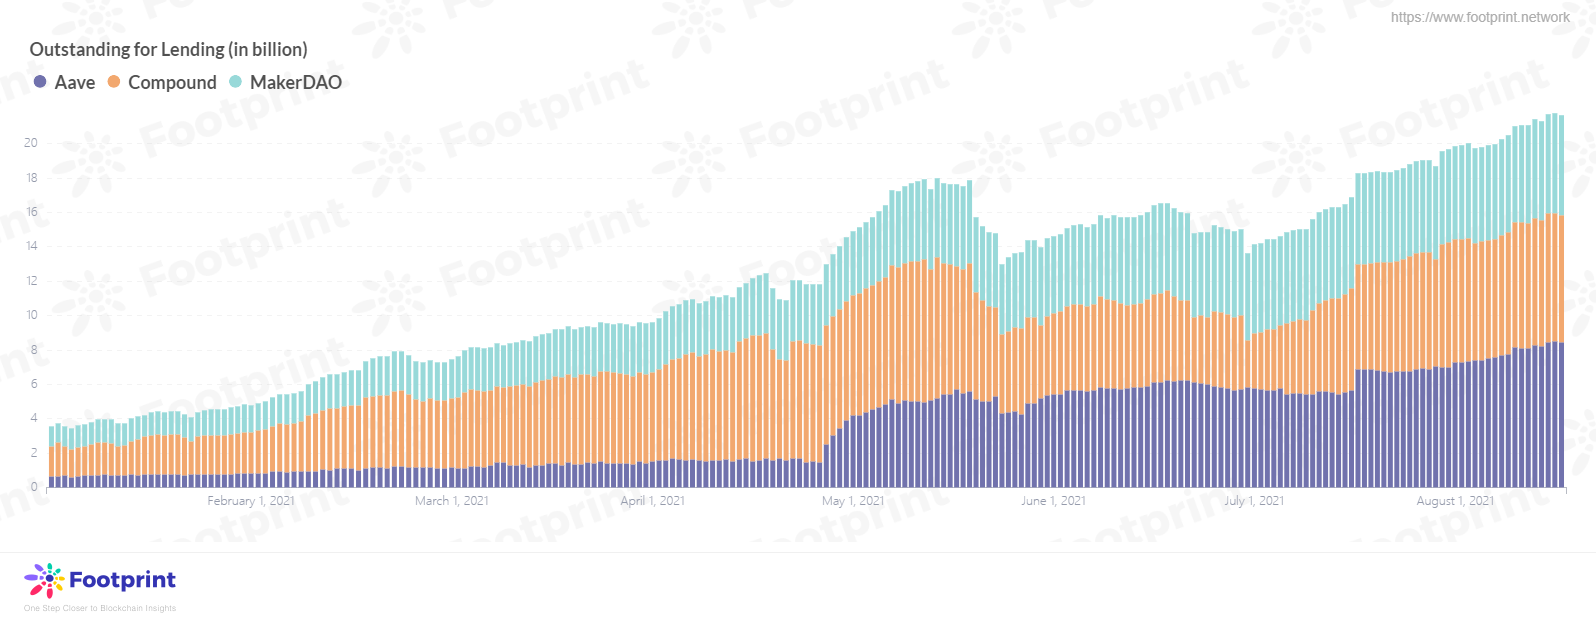
\
**Aave在贷余额实现对Compound的超越**
从各平台Outstanding(在贷余额)的发展趋势看,借贷市场随着DeFi的发展需求趋于旺盛,年初时Outstanding余额仅为35.2亿美金,到7月末Outstanding余额已高达196.6亿美金,仅7个月的时间已创造高达458.5%的增长率。虽5月中旬加密市场受政策影响使得各类代币价格腰斩,但该事件并没有对借贷类DeFi应用产生震慑性的影响,币价的下跌虽触发各平台清算规则使得在贷余额缩减,随后各平台又呈现增长状态,2个月后在贷余额已完成5月体量的超越,可见对借贷类需求的增长增强了其在面对极端情况下的韧性。
5月币价大跌对借贷类平台来说可以算是一个较好的机遇,因每个平台的在贷余额基本回到相同的起跑线上,此后阶段,MakerDAO维持较为稳定的在贷余额,Aave突出重围,7月底的在贷余额与Compound不相伯仲,在8月初已实现对Compound的超越。\
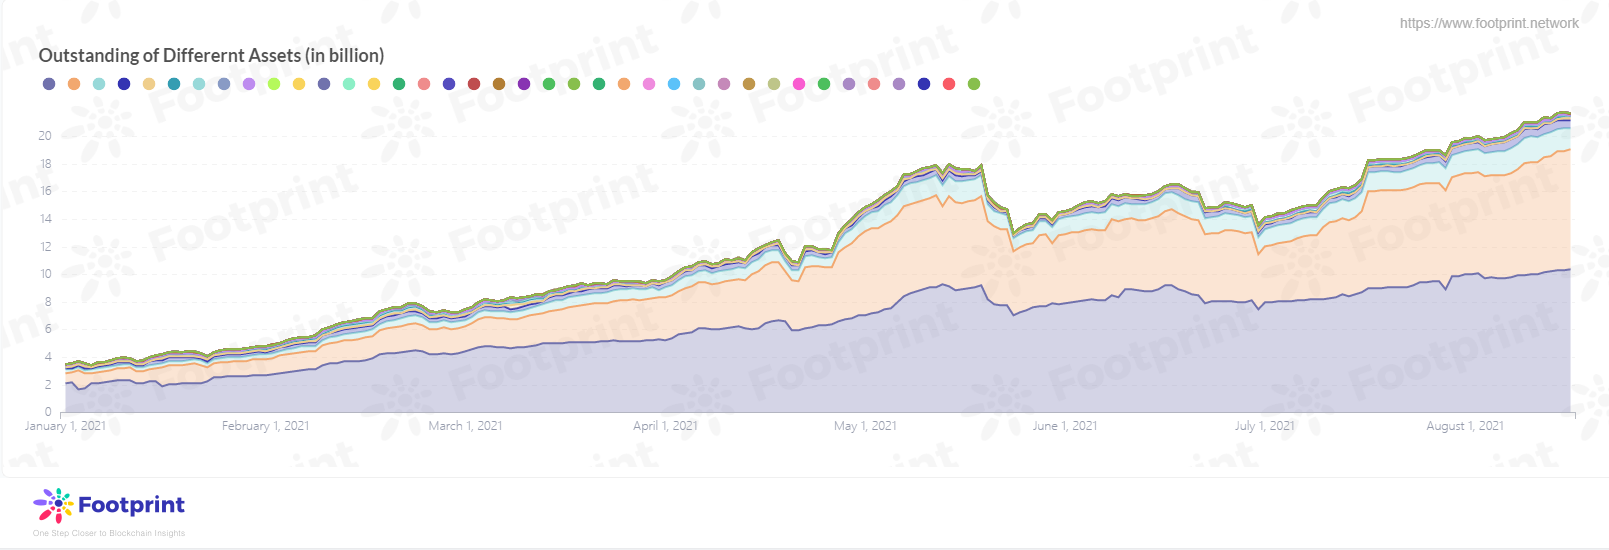
**USDC\&DAI成为头部借贷平台的主要竞争**
我们拆分前三大借贷类平台待收借款余额的资产组成,截止到7月末,借用最高的资产为DAI,其凭借98.8亿美金的待收借款余额,占据了整个待收借款余额的半壁江山;紧随其后的为USDC,该资产需求量发展迅猛,年初时仅占大盘的20.1%,7月末已占大盘的36.5%,该迅速瓜分市场的态势对位列首位的DAI说是强有力竞争者;而USDT占大盘的8.1%位列第三;WETH占2.5%位列第四;剩余类别的资产量占市场份额的2.5%,此处不一一赘述。
从上述对资产类别占有率的细分,可看出当前对稳定币的需求高于其他类别代币,这也主要归功于稳定币的高流通性以及应用的广泛性,该种情况的出现也使得借贷类平台不断新增稳定币类别的资产池,给提供稳定币的用户提供更高的收益,以扩大自身的市场占有率。
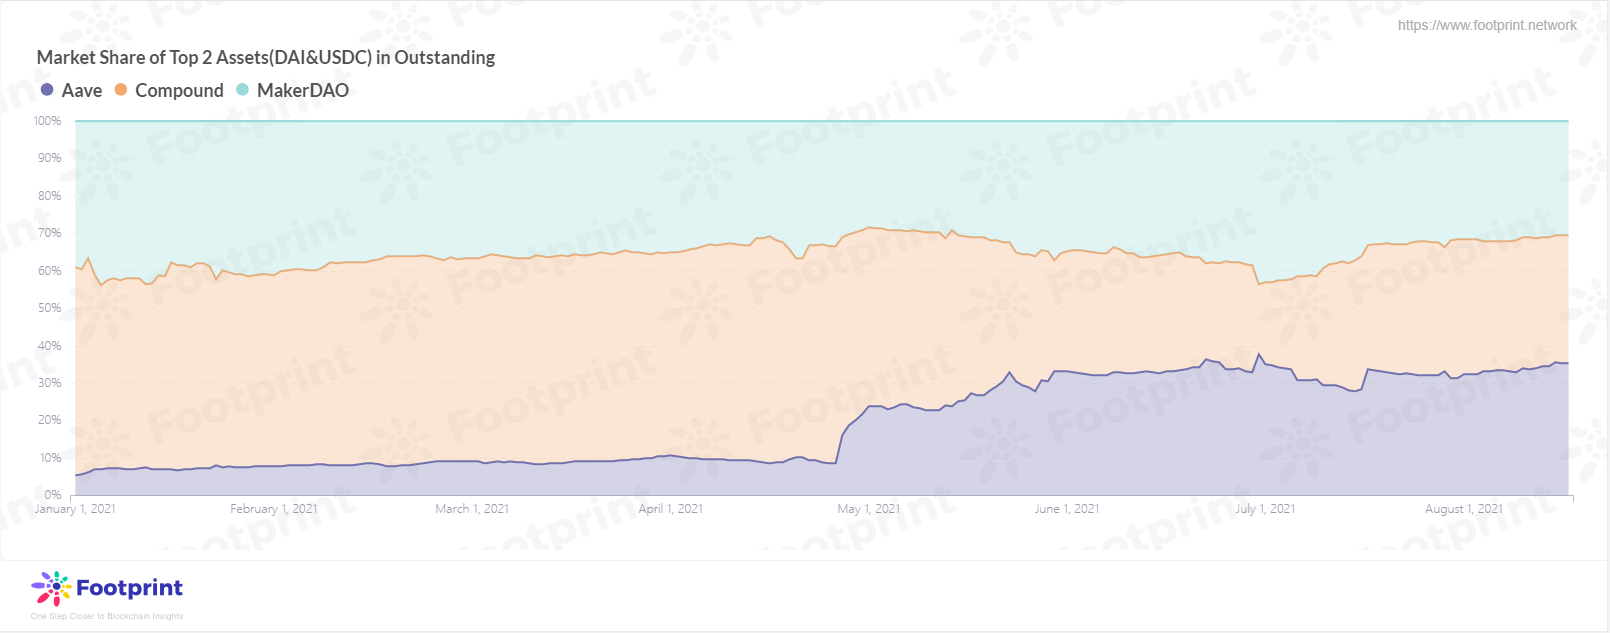
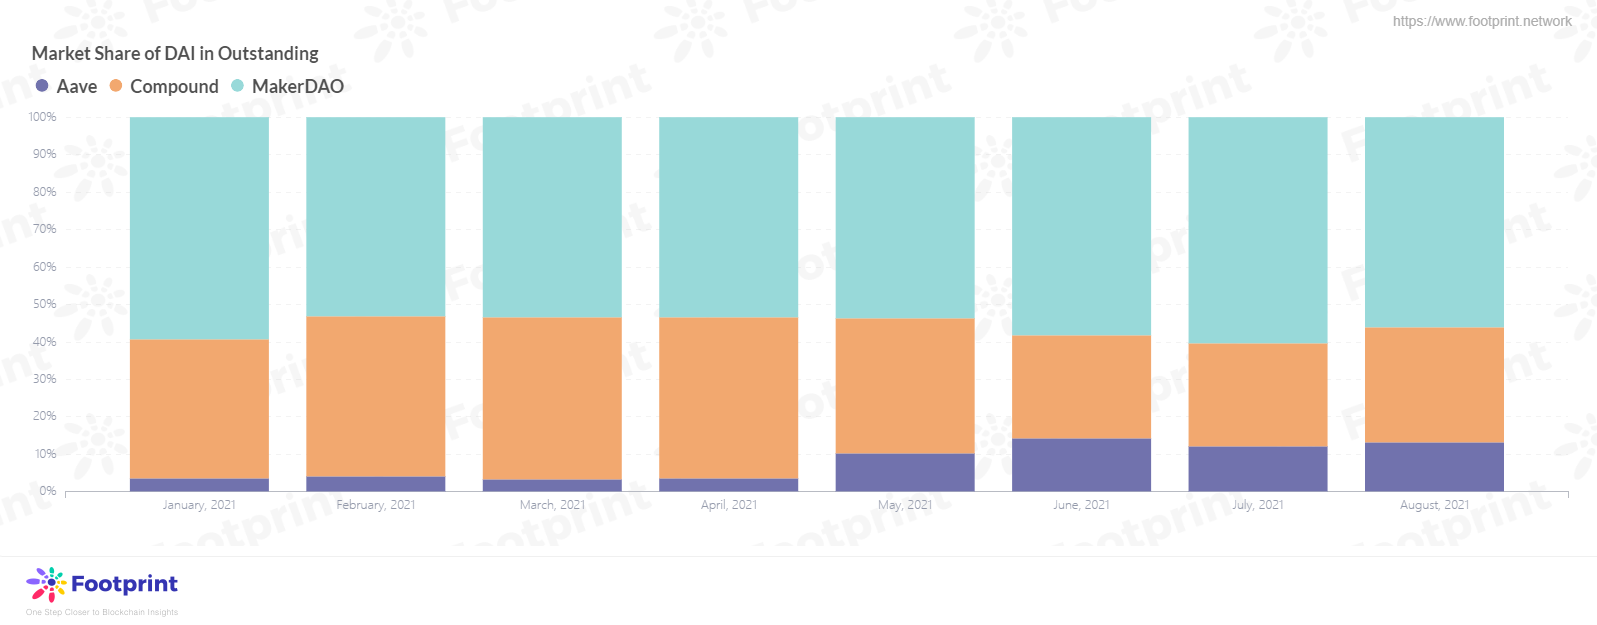
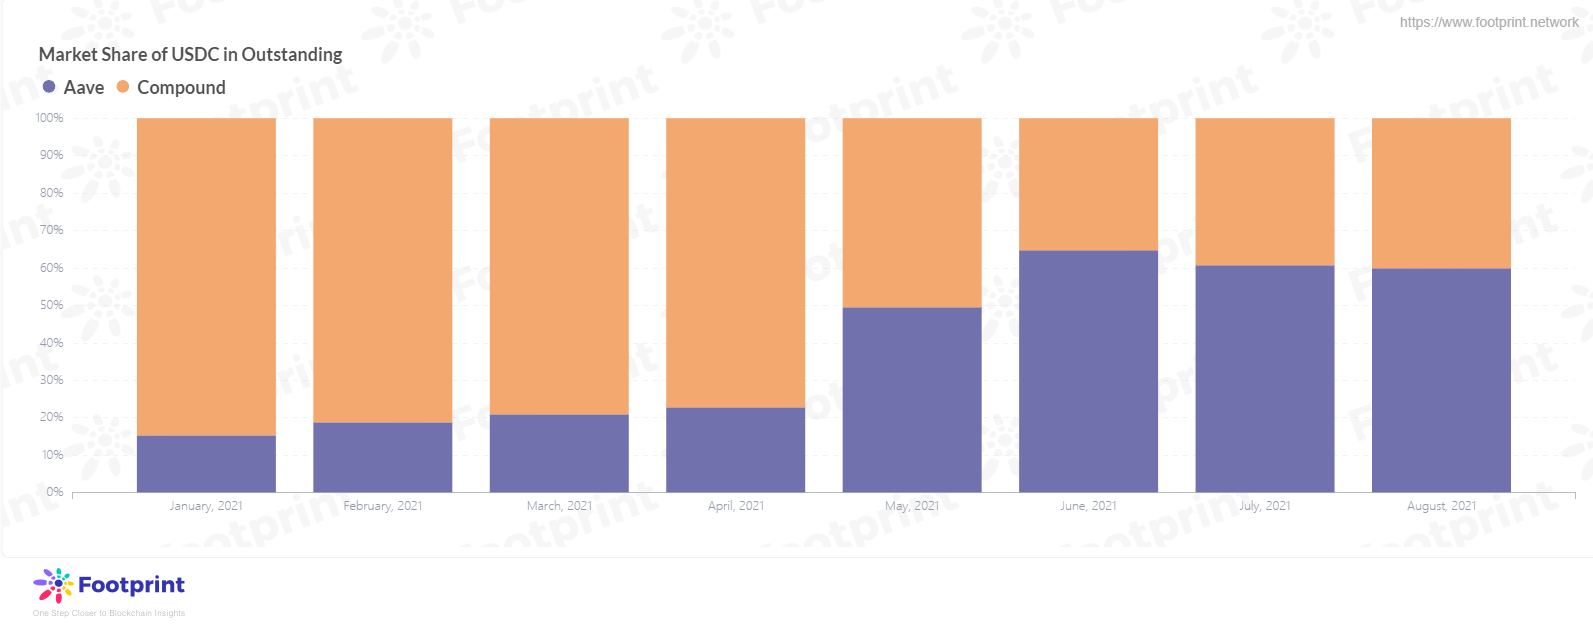
**MakerDAO对DAI占据主要市场份额,Aave对USDC保持强势**
从整体看,年初时平台Compound和MakerDAO占据资产DAI和USDC的绝大部分贷款市场份额,随着Aave上线流动性挖矿,其占有的份额逐渐扩大,当前前三大借贷类平台的份额逐渐趋于平均,对于未来的发展态势,预计MakerDAO的份额会逐渐被其他两大平台侵蚀。
何出此言?一是由于当前MakerDAO主打DAI的借贷,虽说其目前占据DAI在贷总量的58%左右,但Aave厚积薄发,未来MakerDAO能否维持当前的市场份额有一定难度;二是当前对USDC的需求激增,后续UDSC能否与DAI占据相同的市场份额以及超越DAI,只是时间的问题,而MakerDAO并没有提供USDC的资产池,这也增加了让MakerDAO减少市占率的可能性。
反观Aave,其在DAI以及USDC这两种资产的在贷余额占有率持续扩大,特别是USDC,其将会是MakerDAO的有力竞争者。
**4. 资产利用率**
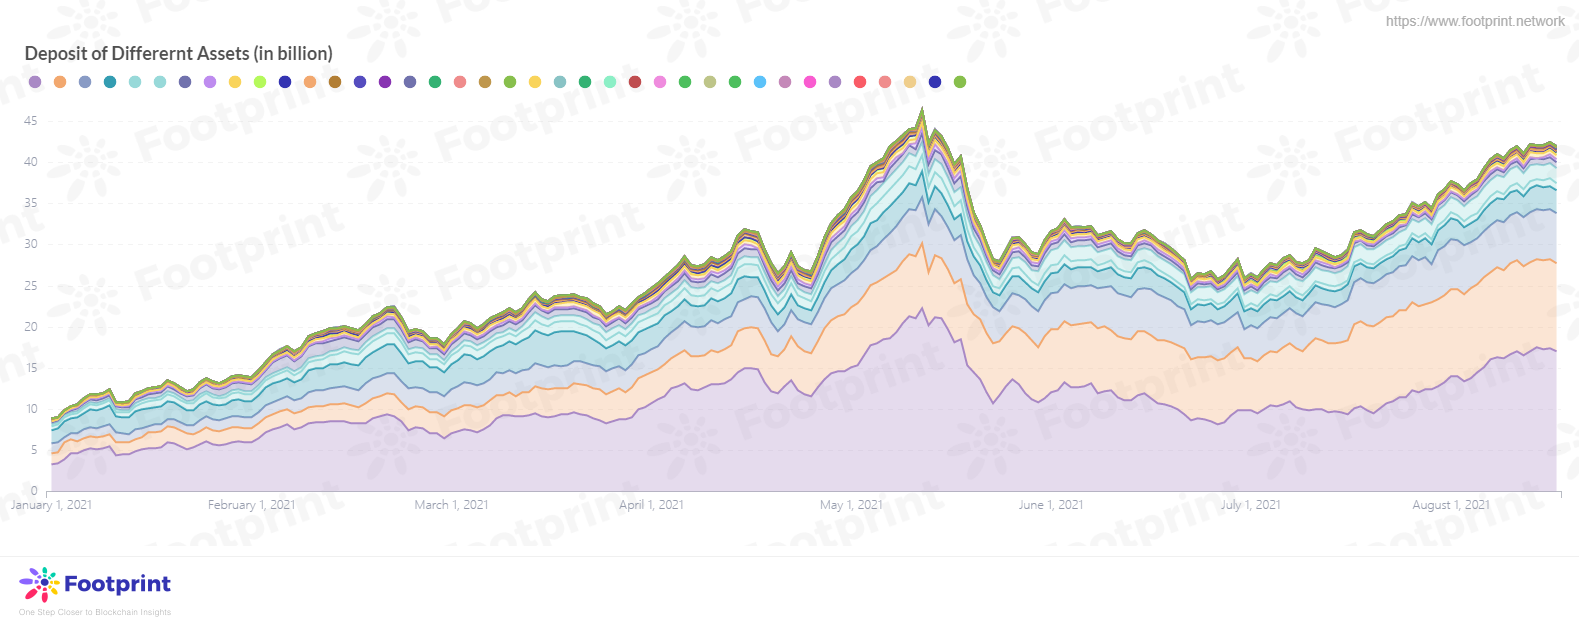
**DAI资产利用率保持第一,USDC紧随其后**
说到资产的需求量,不得不提的就是资产的存入量,对用户来说,平台每种类别资产池子的需求量越多,存入该类别资产的收益越高,对借取该类资产的用户所需付出的成本也就越高,这与池子的资产利用率相关。
从存入的资产类别看,存入了最多的资产为WETH,占大盘的36.2%,WETH的高存入量主要受借款人存入WETH作为抵押从而借取其他类别资产;位居第二、第三位的为稳定币,USDC占大盘28.7%位居第二,DAI占大盘16.2%位居第三;WBTC以7.1%的市场份额占据第四。
综合各类资产的存入量与借取量,稳定币DAI的需求位居第一,但存入量仅位于第三位,因此该类资产的利用率是最高的,在借贷类平台中,DAI资产的存入与借取的利率也是众多资产中最高的;紧随其后的为USDC。\

**MakerDAO资产利用率较高,Aave与Compound紧随其后**
从头部平台的资产利用率对比,可以发现MakerDAO的资产利用率是最高的,Compound与Aave的资产利用率差异不大,保持在45%-50%左右的水平。
出现该种情况资产利用率的分布,我们也可以与平台的运营模式相挂钩。对于MakerDAO,用户可以存入并质押不同类别的资产以换取DAI,存入的资产基本上都会按质押率换取DAI,因此资产的利用率较高;而对于Aave与Compound,因为这两个平台都给存入和借用资金的用户提供流动性挖矿收益,因此对于有闲置资金且并不一定对质押借贷有需求的用户可以以次为由存入资金转去换取相较其他类型DeFi跟高收益,因此资产的使用效率相较较低。
对平台来说,相较高的资产利用率不仅能通过高利率的吸引性吸进更多的资金存入,活跃平台资金池,而且能提高平台的收益,实现双赢。但同时对平台来说是一把双刃剑,因为一旦发生重大安全故事,那么平台很可能出现资不抵债情况,项目则会存在破产风险。
**总结**
通过上述多指标的分析,可判断出当前Aave已超越Compound处于领先的优势,而指标是否对Compound存在低估,抑或Aave能否继续保持当前的优势,我们谁也说不准。因为除了面向个人用户,Aave与Compound也逐渐开发面向机构类客户的产品,Aave推出Aave Pro计划,允许机构和企业通过基于Aave协议获取DeFi评级的收益;Compound推出Compound Treasury让持有USDC的机构获取固定收益,后续谁将成为借贷平台之王,让我们拭目以待。
我们所能期望的,是各类借贷平台能在安全性与合规性最到最好,保证参与DeFi借贷用户的资金不蒙受意外损失;而作为参与者的我们,保持一定的风险意识,不盲目从众。\
\
关于Footprint Analytics \
Footprint Analytics是一个一站式可视化区块链数据分析平台。Footprint Analytics将用户体验放在第一位,它提供了一个直观简洁的用户界面,可以通过拖拽式数据交互,进行查询和可视化数据分析。无论是数据分析师、数据科学家、开发人员、学生、教师、管理者还是项目方,都可以迎合自己的需求,轻松使用这一强大的数据分析工具。\
\
Footprint Analytics网站:[https://www.Footprint Analytics.network/](https://www.footprint.network/)
Discord社区:
微信公众号:Footprint Analytics区块链分析 (Footprint AnalyticsDeFi)
# 6-Solana公链:为何能在众多公链中的大放异彩

撰文:Footprint 分析师
日期:2021年9月
提到Solana大家可能并不陌生,其凭借着丰富多样的生态体系,吸引着越来越多的项目方和用户的青睐。如果论哪条公链在8月表现突出,Solana须占一席之地,其一,反映该公链的代币SOL币价突破112美金,较月初上涨208.9%,9月持续上涨,市值暂列公链第三位;其二,在Solana链上线的去中心化流媒体服务 Audius与TikTok建立合作关系,该合作模式为该项目甚至该链引流大量用户。众多利好消息出现使得Solana越发引人注目,也逐渐显露其对公链的作用。下面我们从多角度分析,Solana为何能在众多公链中大放异彩。

#### **逐渐形成越发完善的生态体系**
与其他公链不同,Solana的发展策略是先提高技术水平和巩固基础设施,再进行生态的完善与发展。
因此,Solana吸引高通、英特尔等拥有强大技术背景的工程师为其提供强大的技术人才支持;通过海平面(并行智能合约)、云散(水平扩展账户数据库)、档案(分布式账本存储)等八大创新技术缓解区块链不可能实现的三角问题,即:安全性、可拓展性、去中心化;通过开展基金会与黑客马拉松结合的活动,挖掘有价值、有潜力的项目,使其在生态中留存。
随着生态的大爆发,该链的生态体系已从原来的寥寥无几,到如今涉猎各赛道,逐渐形成以DeFi、Tools、Infrastructure、NFT、Games、Wallets、DApp、Developer tools 等24大领域332个项目组成的强大系统,生态体系逐渐趋于完善。
#### **低额交易费与高效交易速度**
为解决链上交易拥堵、交易费用高居不下的问题,Solana链采用不同于其他公链的PoH(Proof of History)机制。该机制解决了分布式网络中各区块时间戳完全同步导致效率慢的问题,通过允许每个节点生成本地的时间戳,使得数据更新以及数据状态处理无需等待整个区块链网络同步,以确保交易验证的时间更短,从而提高交易处理效率与安全。PoH机制在1秒可处理高达6.5万笔交易,该吞吐量远高于币安智能链的100笔/秒以及以太链的15笔/秒;随着处理效率的提升以及能耗减少,Solana的平均交易费用为0.00025美金/笔,与以太链的20美金/笔相比,相差约8万倍。Solana链低额的交易费用与高效交易速度不仅为参与用户DeFi用户降低了交易门槛,也吸引了更多的用户与项目方在该公链上线与交易。

#### **3个月内Solana锁仓量(TVL)发展迅猛,位列公链第五位**
从TVL的角度看,虽然以太链还是保持着其龙头地位,占据较大比例的市场份额,但从每条公链的发展速度看,Solana的增速可以说是名列前茅。6月初随着Solana获得由 a16z 和 Polychain 领投的 3.14 亿美元融资额消息一出,Solana这一公链再次被拉入关注的视野中,仅3个月的时间该公链的TVL已实现232%的涨幅,占据1.8%的市场份额,其中表现最为突出的月份为8月,增幅高达138.8%,超越火币生态链(Heco),暂列公链的第五位。

#### **Dex类平台成为Solana链TVL的突出贡献者,多种类别DeFi应用百花齐放**
随着Solana链生态应用裂变式全面爆发,各大领域皆为该公链的TVL增长助力。多种类别的应用中,对TVL贡献最为突出莫过于Dex类平台,其凭借78.4%的高占有率占据DeFi应用的主导地位。虽说Dex类平台当前领跑于Solana链的头部,随着更多类别平台的入场,如4月的Lending类平台Mango Markets、5月Yield类平台Solfarm 、6月Minting类平台Parrot Protocol 以及8月Staking类平台Marinade Finance,Solana链上Dex类平台占有TVL的比例在逐渐下降,相信未来随着更多类别DeFi应用入驻Solana链, 将会呈现百花齐放的态势。

#### **Raydium成为Solana链Dex类平台领跑者,Saber增速高达425%**
再细看Solana链Dex类平台的发展,从6月开始发展速度非常迅猛,不足3个月的时间,Dex类平台上线的数量从原来的3个升至6个,TVL也从8.3亿美金上涨到26.1亿美金,涨幅高达214.5%。其中Raydium作为Solana链上首个使用AMM机制的Dex类平台,在为整个Solana生态系统创造流动性的过程中,逐步扩大其TVL的优势,持续成为Solana链Dex类平台领跑者。Saber作为一个跨链交易所,随着DeFi参与者对于资产跨链转移需求越发旺盛,其凭借425%的增速在8月实现对Serum的超越,位列第二,按照目前的增速其将成为Raydium的有力竞争者。

#### **Solana链的Raydium已闯入Dex类平台的前十位,位列第九**
从Footprint提供的不同平台TVL跨链分布情况看,基于以太链布局发展起来的Dex类平台占据前十名的大多数。虽说以太链的地位无法撼动,但随着众多公链的兴起与发展,其他公链也有出色的发挥,其中作为Solana链头部的Dex类平台Raydium凭借11亿美金的TVL在前十名中占据一席之位,位列第九,这是继以太坊链、币安智能链与Polygon链之后能在Dex类平台上榜的公链。对于未来,作为Solana链发展速度最快的Dex类平台Saber能否也占据一席之位,可以拭目以待。
#### **总结**
Solana公链,在经历大量研发人员的技术投入、投资人看好、生态体系逐渐趋于完善的后爆发了,展露其光芒。Footprint 分析团队将Solana公链多角度的数据呈现在[Solana Dashboard](https://www.footprint.network/guest/dashboard/e22e8f10-57e5-4ce8-bb34-aa8d1c65bbe1#secret=D4A5B4D23807B960B7BEA23282375D57)上,方便读者共同关注该公链发展; 同时Footprint团队也在《[Footprint:公链之争爆发,Avalanche蓄势待发](https://app.gitbook.com/@footprint-analytics/s/insights/v/1/hang-qing-fen-xi/7footprint-gong-lian-zhi-zheng-bao-fa-avalanche-xu-shi-dai-fa)》一文中对目前区块链整体公链有了更全面的剖析。随着加密行业的不断发展,我们有理由相信,其凭借与众不同的创新技术,会继续承载着依托该公链而生各大DeFi应用,继续发光发热。
本文使用的数据均来源于Footprint Analytics,该平台提供跨链、跨平台分析数据以及多角度分析Dashboard,感兴趣的可点击相关链接进行探索。\
\
关于Footprint Analytics \
Footprint Analytics是一个一站式可视化区块链数据分析平台。
Footprint Analytics将用户体验放在第一位,它提供了一个直观简洁的用户界面,可以通过拖拽式数据交互,进行查询和可视化数据分析。无论是数据分析师、数据科学家、开发人员、学生、教师、管理者还是项目方,都可以迎合自己的需求,轻松使用这一强大的数据分析工具。\
\
Footprint Analytics网站:
Discord社区:
微信公众号:Footprint区块链分析 (FootprintDeFi)
# 7-Footprint:公链之争爆发,Avalanche蓄势待发

撰文:Simon\@Footprint Analytics
日期:2021年9月
**公链之争爆发,各公链百花齐放**
随着DeFi项目的回温,各公链也如雨后春笋般发展起来, GameFi、NFTFi、SocialFi 等概念逐渐兴起,区块链似乎迎来了另一个“Summer”,除了最常被提及的以太坊及币安智能链(Binance Smart Chain, 以下简称BSC)外,一些新兴的公链如Polygon、Terra、Avalanche、Fantom也逐渐站在前沿引起人们的注意,本文运用Footprint Analytics上各公链的DeFi数据[Dashboard](https://www.footprint.network/guest/dashboard/35dfdf0f-5c59-4504-9907-7374eae92981#secret=727B0EE190659200095FB5F4868DD0EB)进行进一步的对比与研究。
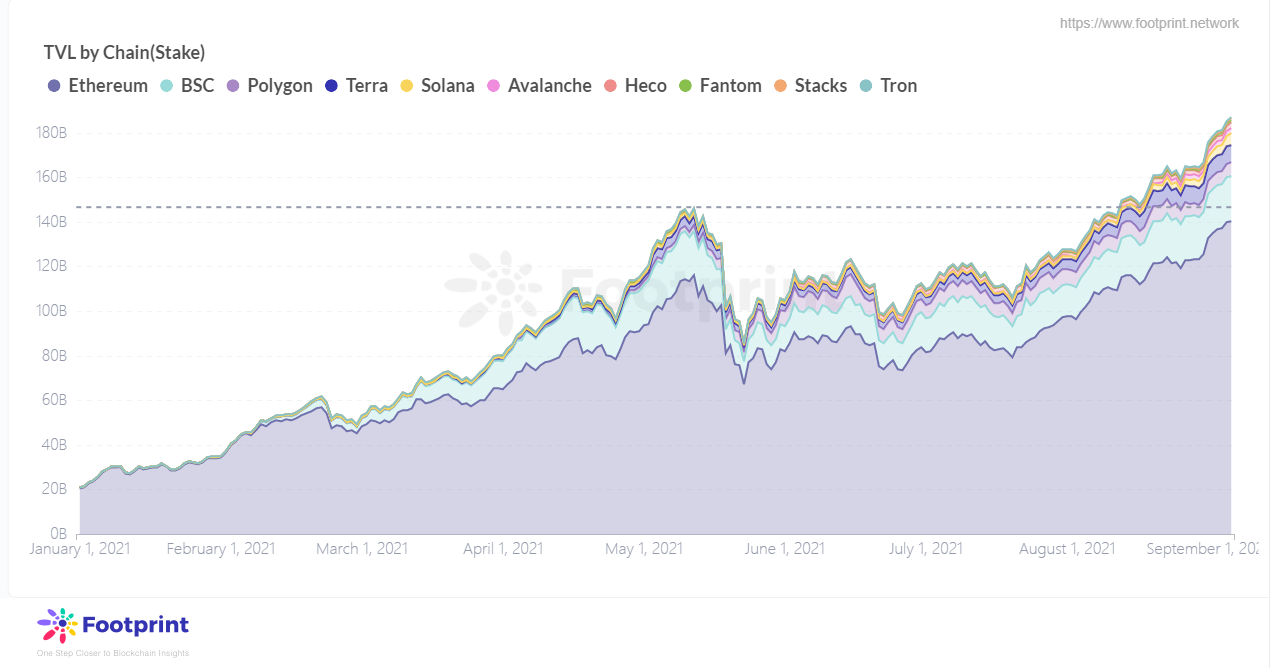
自从5月区块链暴跌后,DeFi经历了短暂的消沉,从Footprint Analytics上统计的TVL数据观察到,排名前十的公链,在时隔3个月后的8月中旬又重新回到了5月的峰值,当然以太坊一如既往的领跑其他公链且上升势头明显,截止到发稿日,以1405亿一骑绝尘。

公链中以太坊占据了75%左右的体量,剩余25%由其他公链瓜分,其中BSC位居第二约10%的体量,其次是Terra约4%,Polygon约3%。Polygon备受瞩目,作为以太坊的原生Layer2,使Aave、Curve、Sushiswap等在以太坊上的头部协议能够很轻松的转移过去,且相对于以太坊上的拥堵和高昂的Gas费,Polygon具有不言而喻的优势。

Polygon从5月开始来势汹汹, 借势以太坊一路势如破竹,趁着5月的动荡时期不降反增,从今年4月Polygon宣布启动1亿美元DeFi基金后,不到半年TVL目前已上升了 5025%。

根据Footprint Analytics上收录的各公链协议数量,以太坊已有276个协议,是第二名BSC的3.14倍,紧随其后的Polygon、Fanton、Avalanche也纷纷开启激励计划,相比以太坊它们拥有更吸引人的手续费及更快速的交易速度,第二梯队的公链在未来的发展也不容小觑。
在各链中,作为DeFi发展的基石——Dex不出意外的成为拥有最多协议的类型,其次是Yield和Lending。一定程度上也受到了以 Aave、Curve 、SushiSwap 等头部 DeFi 协议在今年8月宣布的一项名为「DeFi for the People」的普惠金融计划的正面影响。

TVL前30的协议中,以太坊便占据了18个,第一为Aave凭借跨链部署了Polygon远超第二名近200万,紧随其后的InstaDApp、Curve、Compound三者均约1300万至1400万不相上下。BSC上有8个协议进入前30,PancakeSwap当之无愧以597万排名第一,其次为只有其一半体量的Venus。Terra以拥有4个协议入围排名第三,此公链上以Lending类的Anchor为首,其次为同在以太坊上有部署的Lido和Mirror。

各公链的代币价格反映了用户对该链的估值情况,同时也会影响用户交易的费用,从Footprint Analytics的数据上能很明显得看到ETH与其他代币相比遥遥领先,目前为3941美元,第二名BNB为498美元,虽位居第二但ETH远超BNB7.9倍之多,其次上升比较明显的属于Solana的代币SOL、Avalanche的代币AVAX和Terra的代币Luna,当前价格分别为162美元、47美元和32美元,反而Polygon的代币MATIC目前仅1.68美元,作为以太坊的侧链,与以太坊相比用户在Polygon的消耗的交易费可以说是天壤之别。

代币的交易量上,除ETH外,8月中旬开始SOL有逐渐超过BNB的趋势,虽然在TVL的体量上距离BSC还有较大的差距,但也在一定程度上反映了链上的活跃程度。
**Avalanche蓄势待发,AVAX币价跃居第四**
今年2月BSC开始爆发式增长,3个月后的5月份,Polygon也开始高速增长,又过了3个月来到了8月,Avalanche的飞速增长吸引了人们的注意力。从二季度开始各公链的增长速度,除了Polygon以外最快的便是Solana和Avalanche,分别高达1497%和1124%。Solana在上一次的分析中已经详尽研究([点击此链接了解详情](https://app.gitbook.com/@footprint-analytics/s/insights/v/1/hang-qing-fen-xi/6solana-gong-lian-wei-he-neng-zai-zhong-duo-gong-lian-zhong-de-da-fang-yi-cai)),这次更想运用Footprint Analytics上的数据对Avalanche进行进一步的剖析。

Avalanche在8月19日突然出现爆发式增长,这与更新了以太坊跨链桥和Avalanche 的流动性挖矿奖励计划脱不开关系。8月18日Avalanche 基金会宣布推出 1.8 亿美元的流动性挖矿奖励计划 Avalanche Rush,次日Lending平台Benqi上线,联合Avalanche 基金会推出300万美元的90天流动性挖矿激励计划,用户在平台上借贷可以同时获得 AVAX 和 Benqi 代币 Qi,仅用了4天TVL便突破了10亿,成为Avalanche上体量最大的协议。

与以太坊上TVL超过1亿的协议有66个相比,Avanlanche仅拥有4个,还有很大的发展空间。除受益于Avalanche 基金会奖励计划的Benqi外,排名其后的分别是Dex类的Trader Joe和Pangolin,以及Yield类的Yield Yak。

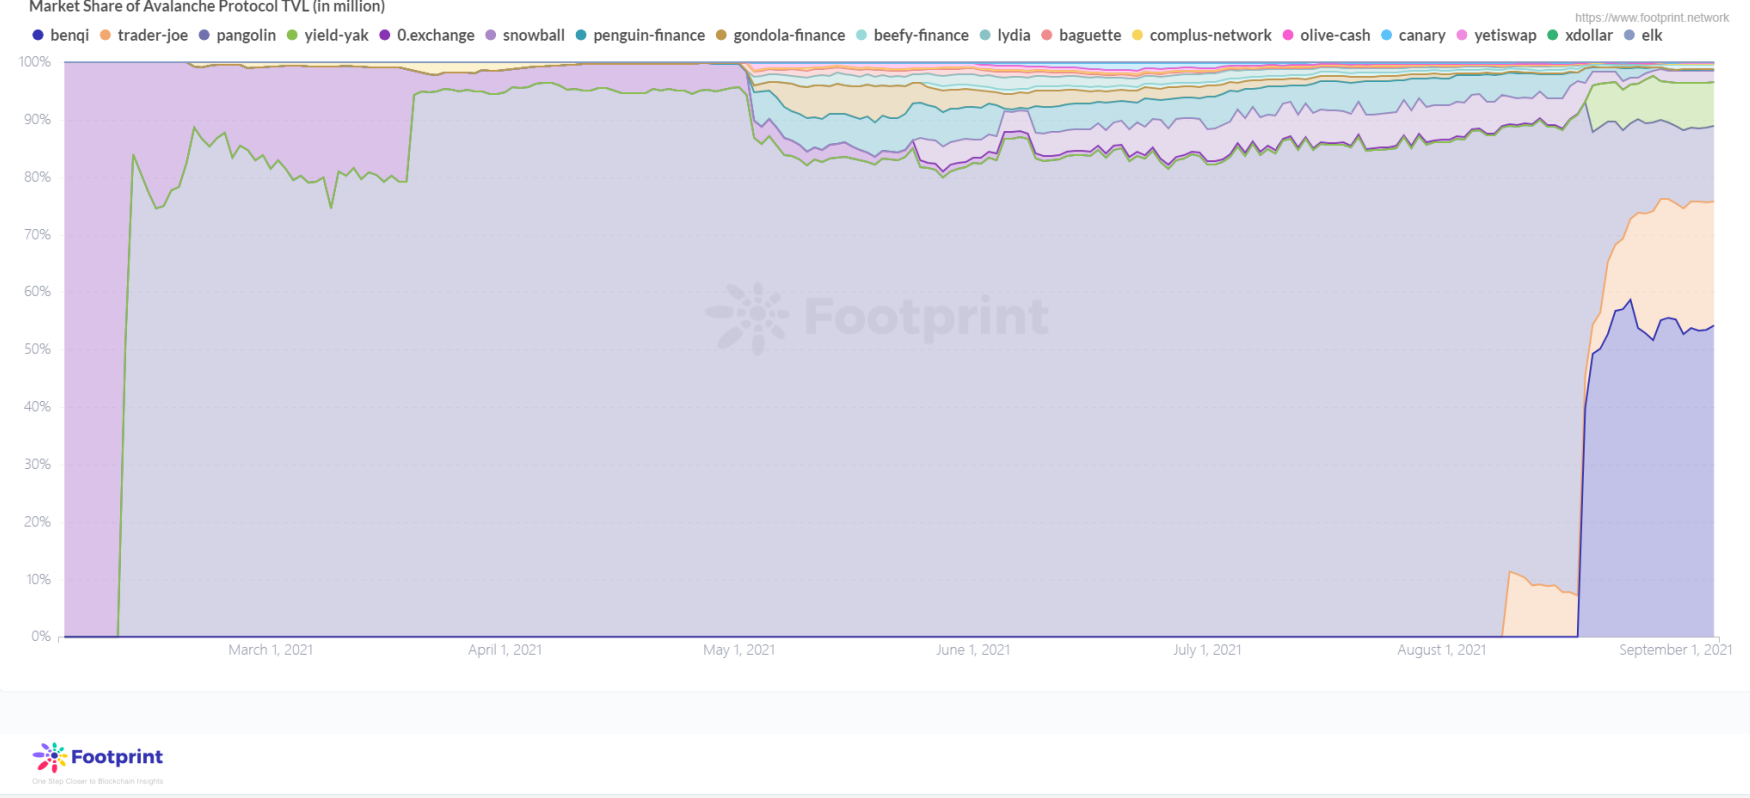
Pangolin为Avalanche上第一个Dex,在2月上线后,虽正好受到此时爆发的BSC的影响,但仍为当时最大的Dex协议,但到8月一直不温不火,Trader Joe协议8月开始发力,逐渐反超Pangolin,目前在Dex中的体量已跃居第一。

Avalanche的流动性挖矿奖励计划也提到了将获得AVAX,除去ETH和BNB,与其他第二梯队的公链代币相比,AVAX目前的代币价格以5047美元排名第二,较8月18日的28美元相比,上升了17867%。
随着Avalanche Rush的推动,Avalanche未来也将继承Aave和Curve这两项在以太坊上TVL最高的协议。Avalanche上TVL和代币爆发式增长的同时,也不要忘记关注它的安全性,以太坊的POW已经历了较长时间的验证,而其他用POS的仍需时间来检验。目前百花齐放的各个公链,溢价被不断地推高,但当各种奖励计划结束后,会是一片狼藉还是继续欣欣向荣都需要用户自己更加谨慎地评估。
Footprint Analytics官网:
Discord社群:
微信公众号:Footprint区块链分析 (FootprintDeFi)
关于Footprint Analytics:
Footprint Analytics是一个一站式可视化区块链数据分析平台。
Footprint Analytics将用户体验放在第一位,它提供了一个直观简洁的用户界面,可以通过拖拽式数据交互,进行查询和可视化数据分析。无论是数据分析师、数据科学家、开发人员、学生、教师、管理者还是项目方,都可以迎合自己的需求,轻松使用这一强大的数据分析工具。
# 8-美国SEC通过BTC期货ETF,对币圈有何影响?

撰文:Footprint 分析师Helen ()
日期:2021年10月19日
**背景**
近日,多家美国主流媒体均报道美国SEC(美国证券交易委员会)即将批准BTC期货ETF,更有彭博社、华尔街日报预估了美国第一个准BTC期货ETF产品的时间,即美国基金发行方ProShares 将于周二(10月19日)发行 BITO(交易代码),截止发稿时尚未正式发行;其他机构也在发行路上: 第一梯队基金发行方Valkyrie Investments、Invesco 和 VanEck将紧跟其后; 第二梯队Galaxy Digital、AdvisorShares、Bitwise、BlockFi 和 ARK Investment Management可能晚一两个月发行。
**发行之后,BTC价格将发生什么变化?民众对该ETF的态度将怎样?**
2021年2月18日,北美首只比特币ETF——Purpose Bitcoin ETF(代码BTCC)在加拿大多伦多证券交易所正式上市,首日总成交量为930万股,交易总额达到1.45亿美元,成为当天多伦多交易所交易最活跃的前十大证券之一。
与此同时,BTC价格一路飙升,就在上市后第二天,2月19日16:00,比特币价格报51675.39美元/枚。自5月份陷入低迷以来,最近BTC价格重回5万,近日甚至一度突破6万,跟ETF利好消息有一定关系。

当时加拿大ETF BTCC发行时,大家就预估美国的BTC ETF也不远了,果不其然,经过各机构长达8年的锲而不舍的申请,美国这次真的要上市了。虽然此次美国首次批准的是BTC期货ETF,但热度目测不减于加拿大BTC现货ETF。 实际上,整个市场已经在蠢蠢欲动,如头部风向标Grayscale Investments(灰度投资)已确认其计划将其比特币信托 (GBTC) 转换为比特币交易所交易基金 (ETF)。
**购买BTC期货ETF,到底买了啥?**
简单说,ETF就是把一堆现金,加上一种使现金随着比特币价格上下波动的衍生品,一起组成一种合成比特币,笔者分析有点类似股票型基金。
如果比特币上涨,ETF 将获得更多现金用于投资货币市场证券。如果比特币下跌,ETF 将不得不出售其中一些证券以交出一些现金。如果比特币翻倍,ETF 的现金或多或少会翻倍;如果比特币变为零,ETF 的现金或多或少会消失。
**BTC期货ETF和BTC现货ETF有什么区别呢?**
**BTC现货ETF的特征:**
1.比特币本身具有现货特性,但跟现金存款不一样,需要区别于国家金融机构的另外一套合规托管和私钥安全性管理的方案; 2.市场上没有出现一个以公允价格购买和退出的完整二级平台。
这也是美国SEC前期一直未批准BTC现货ETF的原因,监管机构先试水BTC期货ETF,既表态支持BTC的发展,未错过区块链红利,又避免将步子一下迈得太开,出现意外情况无法收场。
BTC现货ETF中,发行方需要实际购买比特币并创建较小的股票,因此,发行方负责购买或出售必要的比特币,同时安全存储比特币。在加拿大BTCC中,发行方Purpose Investments将持有的比特币由Gemini Trust离线存储。
**BTC期货ETF的特征:**
BTC期货ETF中,发行方并不持有真正的比特币,而是通过在比特币期货合约中持仓为股票奠定基础。
根据彭博观点专栏作家马特·莱文( Matt Levine)的观点;当我们投一笔钱买BTC期货ETF,比特币 ETF 将如何处理您的资金?答案是它将把大约 70% 的资金投入货币市场证券、国库券或高级商业票据或其他任何东西。
举个例子,如果我们将 60,000 美元投入比特币 ETF,它将在期货交易所投入约 20,000 美元以抵押一个合成比特币,并将保留另外 40,000 美元的现金,赚取一点利息。与此同时,出售合成比特币的人必须拿出大约 80,000 美元来(1)购买实际的比特币和(2)在期货交易所本身发布保证金。
**总结**
BTC期货ETF一旦在美国正式上市,将会成为全球区块链领域一个里程碑事件,美国监管部门从法律上认可了比特币作为金融产品的法律地位,美国对比特币币价的影响力将更大,比特币的币价也将因本次事件上升到一个新的高度,后续发展让我们拭目以待。
参考文献: Bitcoin ETFs Are Almost Here 比特币期货 ETF和现货 ETF 有什么区别
Footprint Analytics官网: Discord社群: 微信公众号:Footprint区块链分析 (FootprintDeFi)
关于Footprint Analytics: Footprint Analytics是一个一站式可视化区块链数据分析平台。Footprint协助解决了链上数据清理整合的问题,让用户免费享受0门槛的区块链数据分析体验。提供千余种制表模板和拖拽式的作图体验,任何人都可以在10秒内建立自己的个性化数据图表,轻松洞察链上数据,了解数据背后的故事。
# 9-Footprint:Liquity的机制真的能实现后来居上?

撰文:Footprint分析师Simon()
日期:2021年10月
数据来源:Footprint Liquity Dashboard()
DEX和Lending作为DeFi项目的两大基石,在区块链市场中占据着重要的地位。Lending里除了占据市场龙头地位的AAVE和Compound以外,今年3月刚刚获得600万美元A轮融资的Liquity以其创新的机制重新定义Lending项目的新玩法,经过“519”币价大跌的考验,证明了其机制的有效性。目前锁仓的ETH仍维持在约40万,约16亿美元。

Liquity除了提供可以通过抵押ETH以获得稳定币LUSD的借贷业务外,还提供另外两个池子可以帮助用户获取额外的收益:存入稳定池LUSD从而划分被清算用户的ETH,同时获取Liquity的代币LQTY奖励;质押LQTY从而获取用户借贷和赎回时的费用。
从Liquity官方的Docs中总结出其优势主要包括了以下几点:
● 利率为0%
● 110%的最低抵押率
● 可直接赎回
● 清算损失小于10%
● 可存入LUSD或质押LQTY获得额外收入
这些看起来非常诱人的优势,真的如所说吗?本文将从以上这5个角度出发,结合Footprint Analytics已有数据来逐一展开分析。
**利率为0%**
Liquity仅支持ETH作为抵押物进行借款,协议提供无息贷款,Liquity称比其他借贷系统会有更高的资本效率。从利率来说确实是0%,但作为借款人更关心的是因借款产生的综合费率。
因此不要忽略的是在借款时会产生一笔借款费用,费率一般在0.5%-5%,根据算法计算费率。上线半年的时间大部分都维持在0.5%,唯一抬升是在“519”币价暴跌前后,最高约为1.16%。
借款人如果在不被清算的情况下,虽无需支付借款利率,但实际要承担一个一次性的借款费用,用户综合的费率仍然在借款金额的0.5%-5%,不过借款人不会有随着时间拉长而不断增多的借款费用,反而可以通过拉长时间来摊薄费用,但如果只是短期的行为折算成年化将会是一个较高的费率。因此,Liquity更加鼓励借款人进行长期借款。
**110%最低抵押率**
在Liquity借款时需开设一个金库(Trove)并向其中存入一定数量的抵押品(ETH),根据抵押的ETH可提取自定义数量的LUSD,但要保证抵押率必须高于110%,当抵押率小于110%时将会被清算。110%的抵押率看似更有效地利用了储蓄的ETH,但还有哪些信息通常会被我们忽略掉呢?
首先,通过尝试可以看到,上文提到借款费(Borrowing Fee)和清算准备金(Liquidation Reserve)也会被算入抵押率中。因此,可以参考下图示例,总的借款金额为2210LUSD,官方给出的抵押率为110%(0.6710*3622.92/2210*100%),但实际借到手可以使用的金额为2000LUSD,按实际可用算抵押率应该为121%(0.6710*3622.92/2000*100%)。
由于清算准备金为固定金额,且如果未发生清算会在还款时还给借款人,因此清算准备金在未被清算时并不算是费用,借款人也可以通过提高借款金额来降低因为借款准备金而被拉高的实际抵押率。

其次,Liquity会有一个恢复模式(Recovery Mode),当系统的总抵押率(TCR)低于150%时将启动恢复模式,对所有抵押率在150%以下的用户进行清算,所以在借款时官方也有提示建议抵押率保持在150%以上以避免在恢复模式下被清算。
再次,用户还可以随时将LUSD兑换为ETH,此行为被称为赎回(Redemption),系统会从此时抵押率最低的金库开始赎回,借款人的金库会同时减少抵押品和负债,虽然被赎回不会使用户发生净损失,但会失去部分ETH头寸。因此为避免被赎回需要保持相对其他人更高的抵押率。
因此,虽然在借款时最低的抵押率是110%,但为了保证账户不被清算或被赎回,抵押率至少要保持在150%以上才会比较安全。通过Footprint Analytics的数据看到,Liquity的TCR即使在“519”币价大跌时经过清算及恢复模式后也能迅速的重返到300%以上,目前TCR也保持在300%左右。可以看到虽然最低可以110%的抵押率,但用户为保证抵押品的安全性仍会选择接受较高的抵押率,此时就需要用户在300%的抵押率和更高的资金利用率之间做下权衡。

不过虽然TCR较高,但110%的最低抵押率相对于其他更高抵押率的协议来说,对被清算带来的损失也会相应减少,这部分也将在下文中详细讲解。
**可直接赎回**
用户可以用LUSD随时按面值赎回相关抵押品,上文中也有提及,但由于赎回时需支付0.5%-5%的费用,同样这一费用会根据最近赎回的时间及赎回的金额进行调整,只有在LUSD的金额小于1美元时,用户才会通过赎回LUSD从中套利,用户可用小于1美元价格的LUSD兑换1美元价价值的ETH而从中获利。因此是套利的空间大还是支付的手续费更多还需要用户根据当时LUSD的价格自行衡量,不过通过Footprint Analytics的数据来看,由于Liquity创始人Robert Lauko所说的“硬锚定”及“软锚定”的机制,LUSD每天的价格波动基本稳定的0.99-1.02美元之间。

从被赎回人的角度,虽然他们在被赎回时点未遭受到净损失,但抵押ETH借款的用户大多都是ETH的信仰者,多数认为ETH是会长期上升的,当他们的金库中的ETH被减少时,实际是减少了之后因ETH上涨而使资产增值的可能性。
因此赎回的行为,对于想从中套利的人来说,只有当LUSD小于1美元且套利收获大于赎回费时才有意义;对于被赎回人来说,赎回行为也并不太受欢迎。不过Liquity通过此机制多提供了一个可以套利的方式,也可以使LUSD的价格稳定在1美元左右,并通过提升抵押率最低的金库保持整总抵押率在较高的水平。
**清算损失小于10%**
当抵押率小于110%时,Liquity会通过清算抵押品偿还了债务,借款人将失去了抵押物ETH,清算会导致借款人的抵押品美元价值净损失9.09%(=100%\*10/110)。
但不要忘了,在借款时还有一笔200LUSD的清算准备金,当发生清算时,200LUSD的清算准备金会被发起清算者获得。清算准备金在借款时虽然不需要用户额外支付,但会被计算在债务中,在计算金库的抵押率时也会被计算在内,因此仍以上图存入金库的金额为例,当因为价格波动导致抵押率下降到110%以下发生清算时,此时被清算的抵押物对应的价值并不是借款人手里拥有的2000LUSD的110%,而是总债务2210LUSD对应110%的美元价值。此时借款人失去了所有的ETH,手里只剩下2000LUSD,按照ETH被清算时的价格计算,借款人实际损失率为17.73%((0.671*3622.92-2000)/(0.671*3622.92)\*100%)。当然不同的借款金额计算的实际损失率也不相同,较高的借款金额会降低因清算准备金而拉高的损失率。
虽然由于清算准备金的因素可能使被清算的损失率并不如设想中的小,但相比于MakerDao要求的150%抵押率来说,Liquity的机制已经是一个很大的进步,对于借款人来说因为价格波动而发生被清算的安全空间也多出了40%。
**可存入LUSD或质押LQTY获得额外收入**
Liquity除了提供借贷可以借入LUSD以外,还提供了提高资金利用率的LUSD稳定池和质押LQTY以获得收益的池子。存入稳定池LUSD可以按其在池子中的占比分得被清算用户的ETH,以及奖励Liquity的代币LQTY;从稳定池中获得的LQTY又可以再进行质押,从而获取用户借贷和赎回时的费用。
稳定池会获得ETH和LQTY,获得ETH与被清算的情况相关,获得ETH的同时存入池子的LUSD会被销毁。由于被清算时抵押率为110%,用户在被销毁1LUSD的同时会获得价值110%美元对应的ETH,用户可从中获利10%。如果此时ETH继续下降使刚刚获得1.1美元价值的ETH降到1美元以下,用户将发生浮亏。为防止这种可能,B.Protocol为Liquity的稳定池提供者自动将ETH转换回LUSD,并将其存回稳定池,为用户锁定了清算利润,节省gas成本。但如果用户是长期看好ETH的信仰者,可能会相信在未来资产终会升值。
然而作为稳定币更重要的还是看它的用例,目前铸造出的6亿多LUSD在Liquity稳定池中的总量超过75%,在外部的流动不足2亿。在Liquity借款的用户兜兜转转仍是在Liquity中投资,整个系统的用例像是一个套娃,其可持续性让人疑惑。

但Liquity的创始人RobertLauko在7月2日回应,稳定池中的LUSD是在大量的LQTY激励下用户的理性选择,后续LQTY代币激励会衰减,用户会据此来改变行为。
稳定池获得的另一个奖励是LQTY,由于不是治理代币,LQTY唯一的用例是捕获协议的借款费和赎回费,只有在借款和赎回发生较多时,LQTY才能获取更多收益,因此反而是整个系统不太稳定的时候才更有利于提升LQTY的价值。可以看到目前每日从质押LQTY获得的ETH和LUSD也并不算多。

在五月中旬受到币价波动的影响,借款和赎回的行为增多,LQTY在此期间捕获收益的能力有快速的增长。但6月开始从LUSD的总流通量也可以看出,用户的借款和赎回行为下降,LQTY不论是捕获LUSD还是ETH的能力都明显下降。
随着后续LQTY代币激励逐渐衰减,LUSD如果能更向外部拓展它的用例,从而吸引更多用户进行借贷,Liquid的TVL保持持续上升趋势的话,LQTY的价值也许可以值得我们期待一下。
**总结**
Liquity从以上5个角度分析,在不同立场会有不同的解读,但正因如此才构成它优秀的机制,在“519”的剧烈震荡下仍能保持稳健。但从借款人的角度出发不论是从借款综合费率还是清算的损失率,更大的借款金额同时拉长时间更能摊薄成本和损失。
但从各个角度来看,Liquity都在不断完成它的机制,创新的清算机制使它从效率和抵押率等方面都有别于MakerDao,Footprint Analytics也将在之后的文章中对比分析Liquity与MarkerDao。LUSD的用例从9月开始也在不断像外部渗透,让我们更加期待LUSD真正成为一个可以广泛应用且占有相当市场占比的去中心化稳定币的那一天。
以上内容仅为个人观点,仅供参考、交流,不构成投资建议。如存在明显的理解或数据错误,欢迎反馈。
关于Footprint Analytics:
Footprint Analytics是一个一站式可视化区块链数据分析平台。Footprint协助解决了链上数据清理整合的问题,让用户免费享受0门槛的区块链数据分析体验。提供千余种制表模板和拖拽式的作图体验,任何人都可以在10秒内建立自己的个性化数据图表,轻松洞察链上数据,了解数据背后的故事。
Footprint Analytics官网:;
Discord社群:;
微信公众号:Footprint区块链分析(FootprintDeFi)
# 10-Footprint避坑指南之: 如何寻找值得投资的DeFi项目

撰文:Footprint分析师Bella()
日期:2021年10月
数据来源:How to Discover Valuable Projects()
随着加密市场的发展与热度上升,吸引着越来越多的DeFi项目涌入,同时也吸引着大批量的投资者。2021年DeFi发展可以用迅猛来形容,TVL(截止发稿前)较年初的214亿美金增长860.42%;链上的DeFi项目也从年初的174个发展到554个,增长率高达218.39%。DeFi市场的繁荣之势不仅让投资者获得高于传统金融投资的收益,也增强了信心。
由于DeFi具有去中心化的属性,一个新项目的开启无需获得相关部门的审批,成本也极低,打着各种旗号进行招摇撞骗的项目也屡见不鲜,稍有不慎就会误入诈骗平台的圈套,项目如此多,如何避坑并挖掘具有投资价值的项目,对个人投资者来说是参与DeFi投资的必修课。

为更好理解不同指标的评估意义,让我们先看看目前TVL排名前10的平台的各项基本指标有何特点:

**总锁仓量(TVL)**
对参与DeFi投资的人来说,TVL这个指标并不陌生,可在各大数据平台(如DeFi Llama、CoinGecko、CionMarketCap)上获取所需的DeFi平台TVL数据。TVL指用户存入并锁定在协议中的资产总额,该值越大代表着该项目集聚的资产越多,用户对该项目的信任度高,更愿意将资产存入该平台进行各类经济活动(如提供流动性、提供抵押等),汇聚的用户量也越多,受欢迎的程度越高。
从上图看,TVL排名前十的平台,除了体量大(高于50亿美金)外,TVL月度基本保持增长趋势,这证明项目在持续保持其活力和实力。
**市值(Market Cap)**
市值反映一个项目在DeFi行业的市场价值,该指标与传统股票市场的计算方式类似,主要受币价与已流通可供交易的代币数量影响。
如上图所示,由于代币数量受流通量以及供需影响,币价是随时变化从而影响市值变化,但市值涨幅或者跌幅保持在20%左右的合理区间,并无出现暴涨再悬崖式暴跌的情况**。**
对基础指标了解后,让我们看如何利用基础指标进行项目评估,发掘有潜力、值得投资的项目。
**TVL排位不宜太后,在排名位列于中段及以上项目挑选对象**

如上散点图,当前的DeFi项目有五百多个,其中,刚兴起以及TVL体量小的项目众多(TVL低于500万美金的平台占比高达33%),如何从众多项目挑选适合投资的项目?安全起见,为防止规模太小的项目出现卷款跑路的风险,个人投资者在确定投资对象时,尽量从TVL位列中段及以上的范围内进行项目挑选(约2,000万美金)。
对DeFi项目来说,100万美金到1,000万美金的项目适合于投资机构进行种子轮投资,不适合于个人投资者,因该类型项目未来的发展定位、战略方向并不明确。
TVL在1,000美金到2,000万美金的项目虽说已找到合适的发展战略,投资者也能获取该部分项目的数据,但从稳定性方面考虑,此类项目存在增长受阻的情况,一旦增长力不足,极易出现增长疲软抑或下跌的风险。
TVL在2,000万美金到5,000万美金规模的项目,一定程度上已经找到明确适合的产品机制与增长点,社区与技术支持逐渐趋于完善,若想要获得高于头部平台的收益,此类平台是一个不错的选择。
如若风险承受能力较低,对收益需求没有太高,则可以从头部平台依据自身喜好的DeFi项目类别(如DEX的提供流动性,Lending的借贷等)选取项目进行投资。
**代币价格稳定,代币分配机制合理**

通过TVL指标挑选合适备选项目后,则需要通过项目代币的情况进行进一步筛选,依据头部平台代币价格变化规律(如上图),主要从两方面进行评估:
其一,代币价格是否保持相对稳定的涨跌趋势(涨幅或者跌幅不宜超过20%)。若代币价格相对保持稳定则表名代币的流通性较为稳定,因单个投资人大量抛售代币而对项目造成损害的可能性变小。
其二,代币的发行机制是否合理。如团队/基金会持币比例是否过高,若过高则该项目为“圈钱”而来的目的性增加;代币释放速度是否过快,释放过快会导致币价被严重稀释,代币被抛售的可能性加大,不利于币价的持续发展。
**用MC/FDV比率确认资产是否适合长期持有**


完全稀释估值指币价与代币最大供应量的乘积,当所有代币释放完毕,市值与完全稀释估值则相等。若项目代币的“MC/FDV”之比(即市值与完全稀释估值比率)过小,意味着有大量代币还未释放,此时投资者则需慎重考虑,重点关注项目的上线时长、代币供应时间表以及币价增长是否过热。
对有长期投资需求的个人投资者而言,评估项目“MC/FDV”的比率是有必要的,随着新代币释放并逐渐流入市场,当供给的代币高于实际所需,估值会变得不合理,随着市场的调节,代币价格随之下降,对长期持有者来说将会面临更大的抛售压力,此时所持的项目代币将会变得一文不值。
以排名靠前的项目为例,对“MC/FDV”比率高于60%的平台,该类平台代币较适合长期持有,安全性有保障,但弊端在于入手价格高;相较比率偏低的平台,如Curve(CRV),虽比率不高,但币价在较为合理的范围,是一个可考虑的平台;相较来说Lido的“MC/FDV”比率低于Curve6.32%,但代币价格高于Curve43.75%,市值估值偏高,目前不适合长期持有,随着市场的自我调整,币价可能会下降。
**用MC/TVL比率评估项目是否值得投资**

据Footprint提供的数据,当前TVL前十的项目“MC/TVL”比率(即市值与锁仓量之比)基本小于1,这代表项目估值处于低估状态,是值得投资的,特别是InstaDapp比率只有0.65%。从经济维度出发,项目的TVL越高,意味着MC也应该越高,因为高TVL表名项目被看好,能为项目带来经济效用更大,市值也应随之提高,达到与TVL相同的体量。
因此在寻找可投资项目时,投资者可以从“MC/TVL”之比的角度出发评估项目的可投资性,比率大于1表明估值可能过高,可投资性偏低,若小于1表明项目被低估,从中获得的回报增加。除此以外,还可将确定投资的项目与头部同类别平台的比率进行对比,看比率与头部平台的差异在何处。
**总结**
读者可使用本文的评估指标,对所投资项目进行评估,汇总如下:
TVL排名位于中段以及以上位置,约2,000万美金以上
代币价格相较稳定:月度涨幅或者跌幅不宜超过20%
代币分发机制合理:团队持币情况以及代币释放速度是否合理
用MC/FDV比率小于5%,项目代币不适合长期持有
用MC/TVL比率小于1,项目适合投资
关于上述涉及计算的指标,读者可直接在Footprint Dashboard获取([点击链接](https://www.footprint.network/guest/dashboard/97bd7a34-8221-4eab-afe9-23b9a00567ec#name=How%20to%20Discover%20Valuable%20Projects%20)),无需额外计算。
通过上述指标进行一番分析后会发现,DeFi作为新型的投资市场,由于“新“与容纳性,创造出相较传统金融更多的投资可能性,样式也越发丰富,有许多值得投资的项目被人知悉与了解,也有许多有潜力的项目还未被发掘。
但机遇与风险是并存的,我们不能仅依赖上述的指标就能对项目是否值得投资、是否具有发展潜力做定论,因为DeFi市场变幻莫测、更新换代的速度太快了,指标也会有失灵的时候,为减少踩坑的可能,在投资前还是需要对项目背景、项目经营模式等多做一些搜索与了解,切勿盲目跟风。
Footprint Analytics官网:;
Discord社群:;
微信公众号:Footprint区块链分析 (FootprintDeFi)
关于Footprint Analytics:
Footprint Analytics是一个一站式可视化区块链数据分析平台。Footprint协助解决了链上数据清理整合的问题,让用户免费享受0门槛的区块链数据分析体验。提供千余种制表模板和拖拽式的作图体验,任何人都可以在10秒内建立自己的个性化数据图表,轻松洞察链上数据,了解数据背后的故事。
# 11-Footprint:Aave作为DeFi借贷之王,是机缘巧合还是早有预备

撰文:Footprint 分析师Bella ()
日期:2021年10月
数据来源:Aave Dashboard
说起传统借贷,或许大家并不陌生,让人联想到的有信用贷、抵押贷等多类型借贷业务。随着加密市场的发展,以传统借贷为基石的加密借贷登上DeFi的舞台,作为有潜力的赛道,涌入越来越多加入加密借贷的平台与参与者的同时也逐渐分割DeFi市场的占有率。
从Footprint提供的数据看,今年年初DeFi借贷类平台的数量为19个,TVL为41.1亿美金,占19.3%市场份额,仅过十余月(截止发稿前),平台数量已飙升至69个,增长率高达263.16%,TVL484.4亿美金也创高历史以来新高,占21.04%的市场份额,位列第二。

加密借贷行业的发展,离不开各大借贷类平台的突破、创新与贡献。从借贷类平台TVL数据看,Aave、MakerDAO、Compound三大平台虽持续称霸DeFi借贷业务的龙头地位,但519事件爆发后,借贷行业迎来了新一轮的洗牌,Aave从原来的第三位一跃升至第一,相较Aave的发展势头,MakerDAO与Compound略显疲软。作为能称霸DeFi借贷之王的Aave,究竟是机缘巧合还是早有预备,下文为大家带来详细的分解。

**数据概况**


首先从数据维度看借贷巨头Aave的表现:
TVL:187.3亿美金(其中以太链145.1亿美金,Polygon19.6亿美金,Avanance22.6亿美金),较年初20.2亿美金增长827.23%,位列借贷类平台第一,占34.81%市场份额;并于10月20日超越Curve,回归DeFi平台首位。 代币情况:当前代币价格为$316.34,年初代币价为$88.3,较年初上涨258.26%,币价位列加密货币的13位。 市值:41.7亿美金,位列借贷类平台的第一位 在贷余额:83.7亿美金,位列借贷类平台第一,从5月开始在贷余额占比持续扩大(Compound70.2亿美金;MakerDAO74.2亿美金)
备注:最新数据截止发稿前
**项目背景**
Aave的前身是ETHLend,于2017年11月在以太链上线,此时平台的运作模式与P2P类似,贷款人与出借人在平台上发布需求,平台通过智能合约将符合需求的借贷进行点对点撮合,但由于此类模式借贷双方需求差异过大,导致撮合的成功率与效率极低,于是团队开始调整发展模式。
2019年项目完成品牌升级,命名为Aave,并于2020年1月正式上线,该版本通过建立资金池提供流动性,着重解决借贷需求撮合效率低的问题,用户存入抵押资产后可在抵押率范围内借入资产,无需一一匹配需求,从此Aave开始了新篇章。
2020年7月,Aave获得ParaFi450万美元以及Framework Ventures和三箭资本参投300万美元战略融资,也发布了经济提案(Aavenomics),内容包括将原有代币Lend转换为AAVE并增发300万代币、安全模块、借贷激励等。
2020年10月,Aave获取Blockchain Capital和Standard Crypto领头的2,500万美金融资,除此以外,获得美国SEC批准的以太坊信托注册申请。
2021年2月,Aave完成V2版本升级;3月上线AMM市场,允许流动性提供者质押来自Uniswap和Balancer的LP token进行贷款;4月通过流动性挖矿计划为借款人与出借人提供代币激励;5月部署上线Polygon链;7月推出面向机构客户的全新产品Aave Pro;10月部署上线Avalanche。
从上述Aave的项目发展历程可见,该项目一直致力于项目的创新与突破,为用户提供更好的使用提体验,取得的成就并不是机缘巧合。
**经济模式**

Aave的经济模式于2020年7月上线,经济模式中对代币AAVE的用途主要分为三种,分别是社区治理、安全池建设和生态系统奖励。
社区治理:持有平台代币AAVE用户可参与社区治理,如参与关于平台生态系统保护,安全池机制更新、新功能迭代等方面的投票,一个AAVE代币一票。
安全池建设:用户可将持有的代币AAVE质押存入安全池,用来抵御风险事件发生,如合约漏洞风险、流动性风险(抵押品抵押率不足产生的清算风险)、预言机风险(由网络拥堵或市场大跌导致,预言机不能更新价格或价格提供错误)。
生态系统奖励:给予借款人与出借人的代币奖励,相当于流动性挖矿。
为使项目能安全、平稳低运行,Aave在安全方面运用许多创新机制,也倾注了许多努力,不仅将安全池的建设纳入生态建设的一部分从而为风险事件的发生提供安全垫,还对发现安全漏洞的用于给予奖励。这些未雨绸缪的举措,都为Aave的突破性发展提供支持。
**闪电贷**

相较其他借贷类平台,Aave还有一项首创优势业务,那就是闪电贷。闪电贷是Aave团队对智能合约的深入调研后开发出来的产品,该产品对于使用者来说有一定的门槛,适合有一定编程功底的开发者。该产品的特点在于用户可以轻松获得借款,无需抵押任何的资产,用户只需在同一区块内将借用资金归还即可(约15秒),若无法在同一区块将贷款还清,交易就会被撤销,不对用户产生任何影响,若贷款成功,只需支付0.09%的手续费。
截止目前,闪电贷的累计出借金额已超越98亿美金,预计在10月末将会突破100亿美金。虽说519事件后整个加密行业处于恢复阶段,闪电贷的交易量有所下降,但不可否认的是该产品的爆发式增长,为Aave超越Compound和MakerDAO提供强大的动力支持。
**资产种类与利率**

在资产种类上,相较其他借贷平台也更加丰富。V1与V2版本在单币质押上支持稳定币、主流加密货币以及新兴加密货币共计31种资产,AMM版本支持Uniswap和Balancer的LP token质押,资产类别高达16种。该差异化策略大大满足多类别群体的借贷需求,吸引更多的用户参与与留存,同时也加速平台规模扩大与影响力提升,为实现弯道超车奠定基础。
资产种类的优势让Aave资金池规模不断扩大之余,让其拥有更多的空间创造独特的利率优势。首先整体的借款利率相较其他平台更低(资金利用率在相同维度下),此外还给存款人与借款人提供流动性补贴(虽流动性补贴不是Aave首创)。其次开创利率互换先河,在借款利率上用户可以自由选择浮动利率或固定利率两种策略,若当前选择的利率更高,则用户可以切换到利率更低的策略,让借款人在波动性较大的去中心化市场获得成本更低的资金。
**Aave Pro**
原以为Aave就这样按部就班发展下去,没想到Aave在V2版本试用信贷委托模式(无需抵押即可获得贷款)取得成功后,再次给加密借贷甚至整个DeFi行业带来又一重磅消息,推出Aave Pro项目,将DeFi与传统金融融合,为线下投资机构提供进入DeFi的新通道。
当前参与DeFi的用户有三千多万,相对于机构投资者来说个人投资者资金十分有限,除此以外,DeFi在经历一年多的爆发式增长后,虽有突破,但增长持续的时间大不如前,不久的将来DeFi将会迎来瓶颈。如何突破?打通加密市场与实体市场的壁垒,获取场外更多资金入驻,无疑是一个更好的选择。而场外资金更多的归集在机构投资者手上,作为获得英国FCA颁发的电子货币机构许可证的Aave可在更合规、更安全的维度保证资金的安全让机构投资者参与进来,促进整个生态的良好发展。
Aave Pro与原有的V1 、V2甚至AMM都不一样,其一,Aave Pro仅向场外的机构投资者开发,只推出了USDC、BTC、ETH、AAVE四种资产;其二,Aave Pro是一个私人资金池,与Aave协议的资金池完全区分,做到风险完成独立;其三,参与的投资机构需要通过Fireblocks的KYC验证,通过KYC信息评估信用等级,并依据不同的信用等级采用不同的抵押率,大大降低资金的安全性。
**总结**
通过上述不同维度的剖析,可看出Aave之所以能成为借贷之王,并不是机缘巧合,是其团队对DeFi的深度思考、对安全性与合规性的高度把控以及对突破与创新的高要求,铸就而来了。特别是Aave Pro的面世,让其逐步拉开与头部借贷类平台的差距,Aave必将迎来新一轮的发展高潮,也必将引领DeFi朝新方向突破。
Footprint Analytics官网:;
Discord社群:;
微信公众号:Footprint区块链分析 (FootprintDeFi)
关于Footprint Analytics:
Footprint Analytics是一个一站式可视化区块链数据分析平台。Footprint协助解决了链上数据清理整合的问题,让用户免费享受0门槛的区块链数据分析体验。提供千余种制表模板和拖拽式的作图体验,任何人都可以在10秒内建立自己的个性化数据图表,轻松洞察链上数据,了解数据背后的故事。
# 1-Footprint 7月月报:DeFi市场逐步恢复,能否对8月抱有信心

撰文:Footprint分析师Bella\
日期:2021/8/9
受5月币价下跌的影响,6月DeFi的表现不尽如人意,DeFi应用的各类型平台交易量下降、用户活跃度不高,虽DeFi不是首次经历币价大跌的事件,但对参与DeFi的用户来说,市场的不明朗让期望值降低,对市场何时能恢复5月的水平存在更多的未知。Footprint7月的月报从多指标出发,评估DeFi市场7月的恢复情况,预估8月的变化。
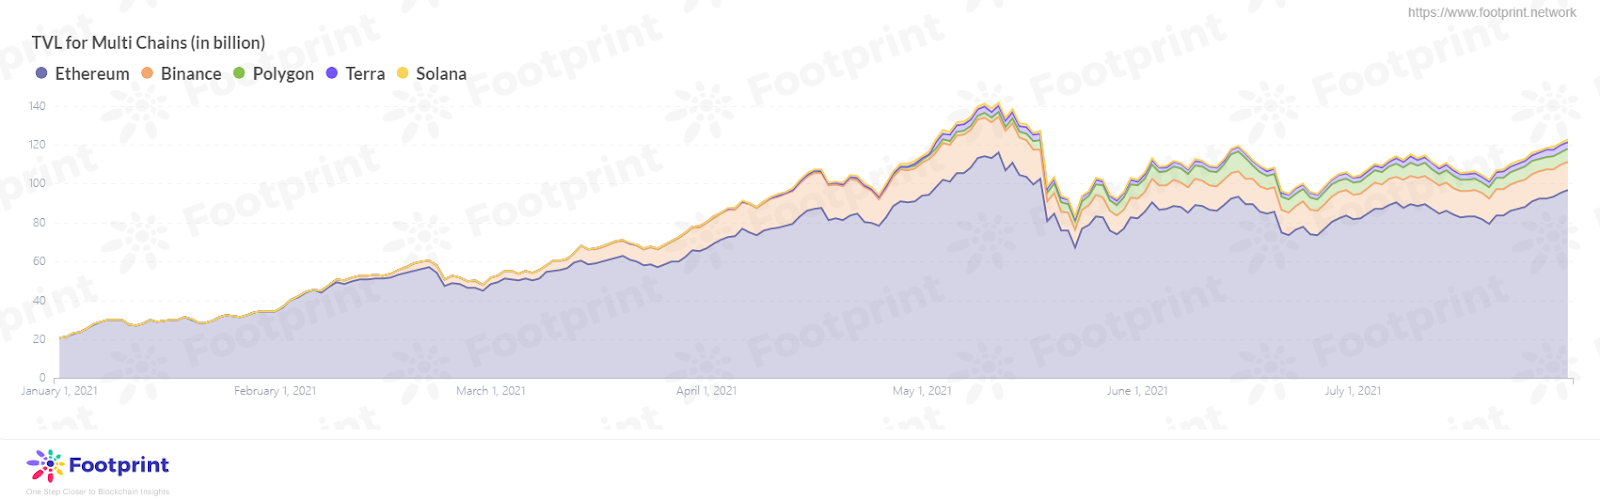
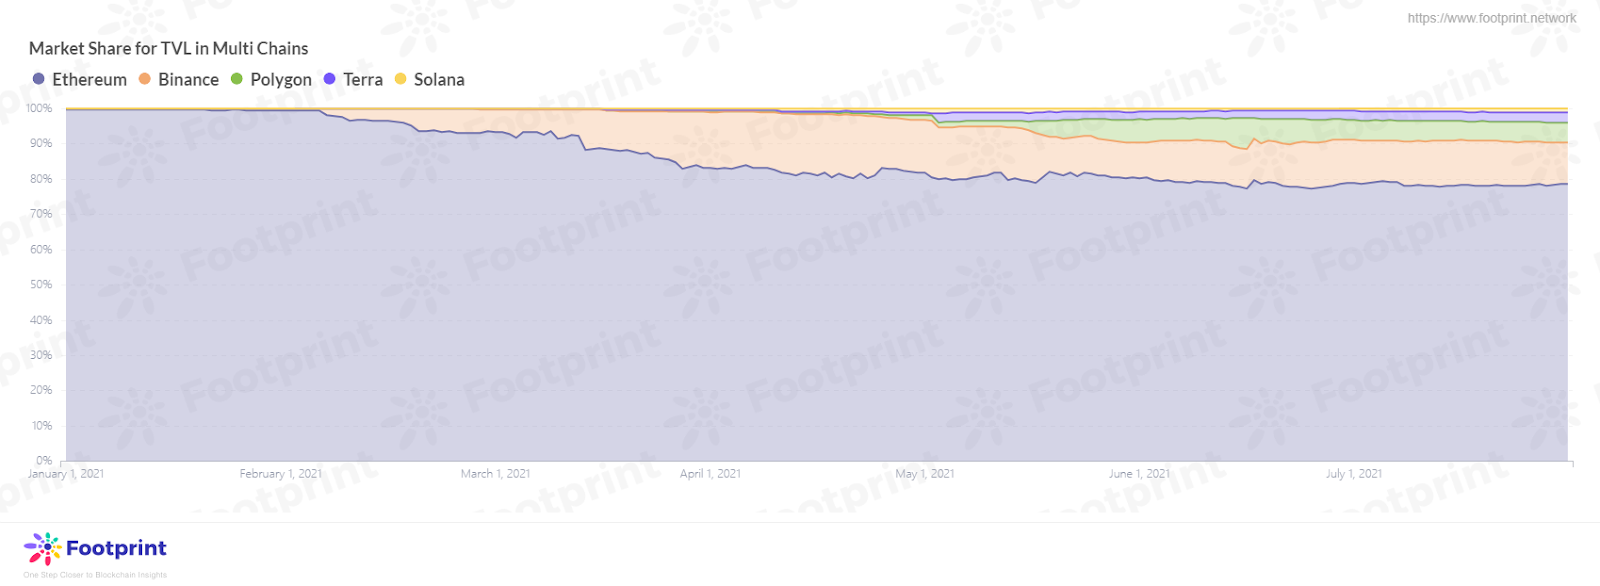
**多条链的TVL呈上涨趋势,Polygon和Terra已恢复5月水平**
据Footprint提供的数据,7月多链的TVL为1,230亿美金。其中以太链以968.3亿美金占据榜首,占市场份额的78.7%,继续保持其无法撼动的地位,在7月以太链取得15.8%增长率的成绩,虽与其他链相比增长率没有表现突出,但从当前的增长速度看,预计8月中旬以太链的TVL就能超过5月的水平,再创新高;而币安智能链TVL相较6月虽有10.73%的增幅,达到145.5亿美金,从整体的趋势上看,还是维持在一个较为稳定的水平,对币安智能链来说8月能回到5月的峰值水平是有点难度。
在7月表现较为惊艳的是Polygon链、Terra链以及Solana链。Solana凭借Raydium平台TVL的提升,让其获得135.6%的增长率,市场占有率也从原来的0.6%提升为1.1%;Polygon与Terra的TVL已超越6月,恢复5月水平,分别占市场份额的5.4%(Polygon) 和2.9%(Terra),随着部署在Polygon与Terra链的DeFi规模逐渐扩大,越来越多的平台考虑部署在不同链上,预计在不久的将来,它们会成为币安智能链的有力竞争者。
下面我们从TVL排名前两位的以太链与币安智能链进行进一步跨链分析。
### 一、TVL
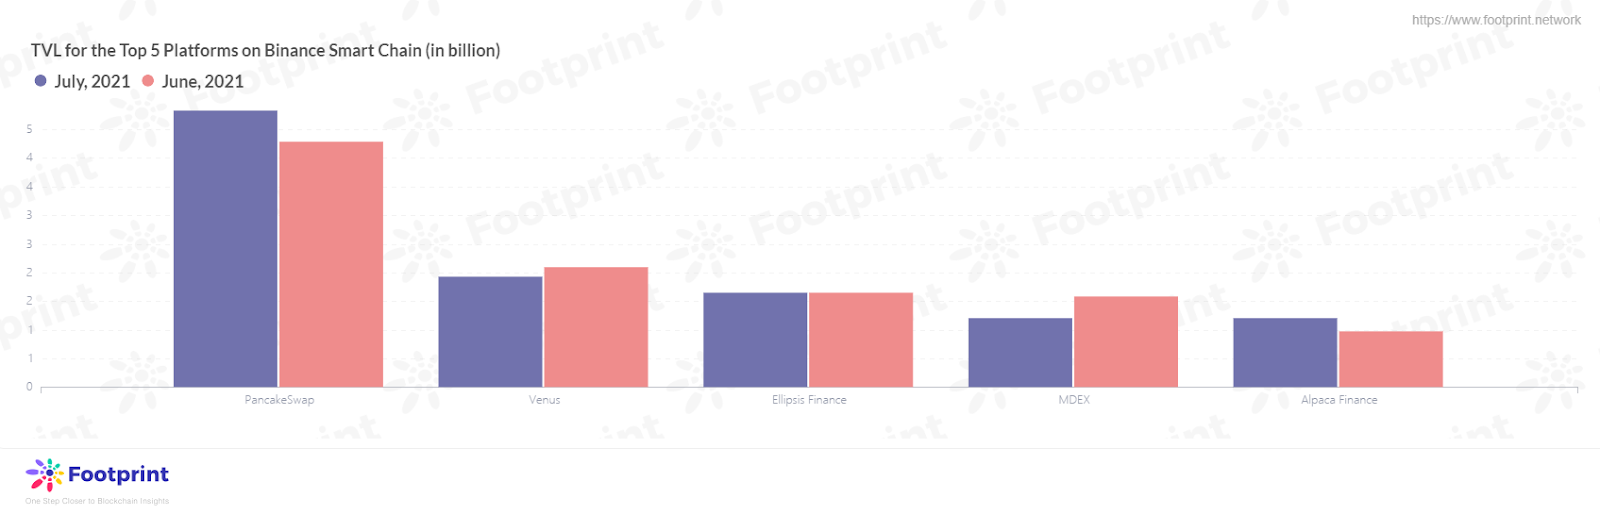
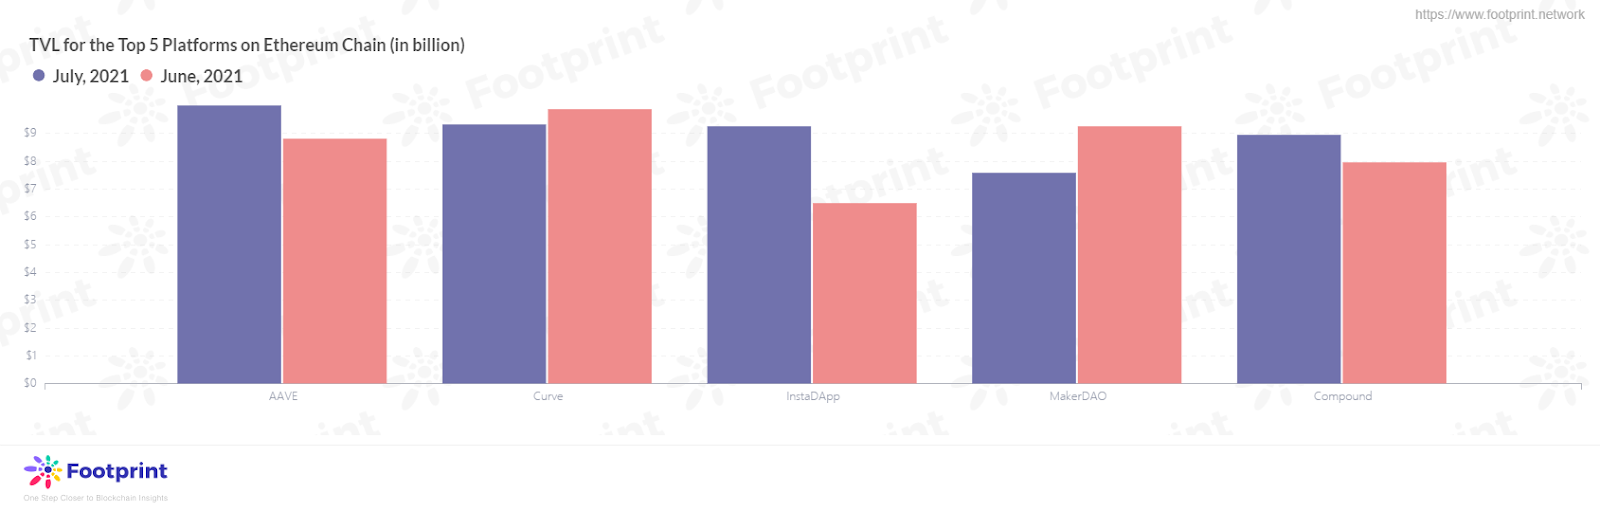
**借贷类、资产管理类、机枪池类平台在7月有不同涨幅度**
我们再细看对以太链与币安智能链TVL贡献度较高的平台,以太链贡献度最高的的Aave(99.9亿美金,环比+13.3%),紧随其后的是Curve(93.1亿美金,环比-5.8%)、Compound(89.5亿美金,环比+12.3%)、InstaDApp(87.3亿美金,环比+34.7%)、MakerDAO(75.9亿美金,环比-17.9%)。其中环比增长率较高的莫过于专注去中心化资管协议的InstaDApp。为什么InstaDApp能在众多的项目中得到快速的提升?我们从Footprint输出的数据上看,增长率仅次于InstaDApp的是借贷类平台,而InstaDApp凭借其一键债务转移、债务互换、抵押品互换等强大功能,让参与借贷类投资活动的用户可以实现资产在不同协议相互转换,给用户提供一道跨平台交易“桥”,降低用户在多个借贷平台的操作难度之余,也能降低交易成本。
在币安智能链上线平台的TVL都低于50亿美金,其中对币安智能链贡献最大的平台为Dex 类的 PancakeSwap,7月的TVL为48.3亿美金,较6月增长12.9%,占整个币安智能链TVL份额的33.2%。从增长率看,增长率最高的为Alpaca Finance , 增长率为23.5%。
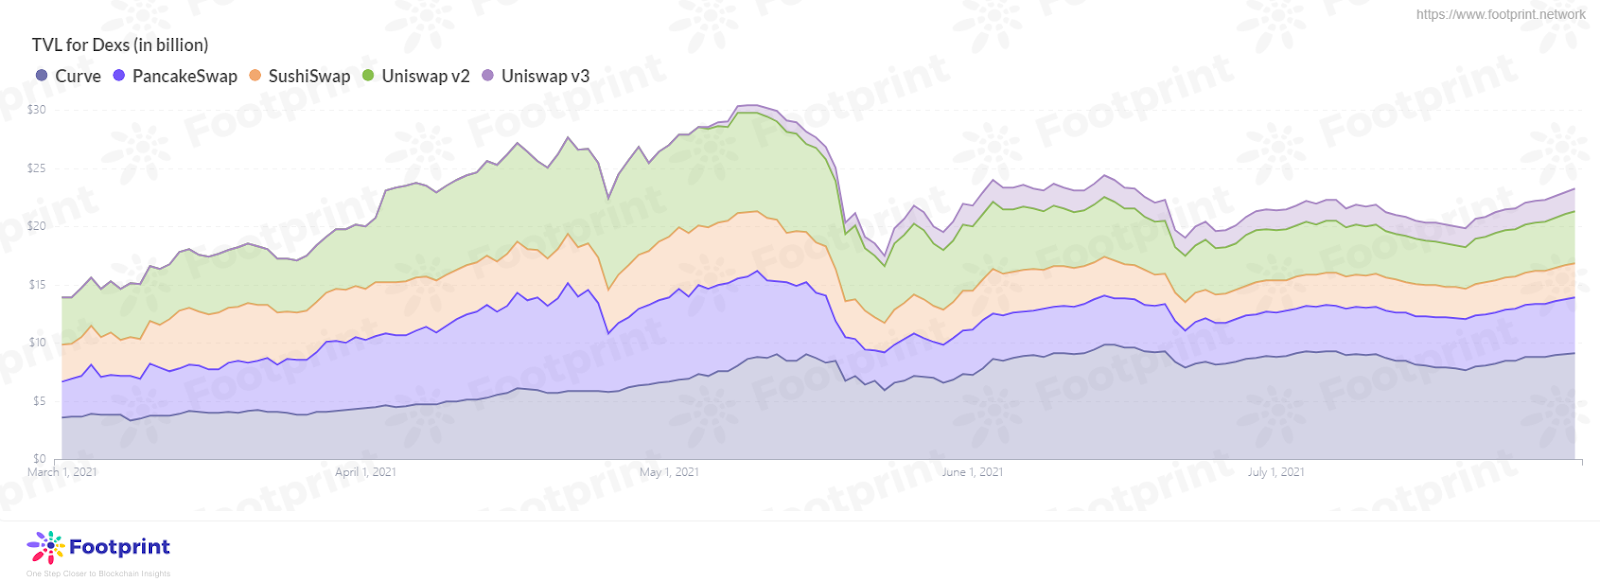
**Curve继续发挥其在去中心化交易所的作用,PancakeSwap超越Uniswap V2位居第二**
随着加密市场的恢复,Dex类平台的TVL在7月也在稳固上升。其中PancakeSwap较6月环比增长27.1%,是头部Dex类平台涨幅最高的,紧随其后的为Uniswap V3(环比+11.1%),SushiSwap,(环比+8.7%),Curve(环比+2.5%),Uniswap V2(环比+1.8%)。作为当月增长率最高的PancakeSwap在7月实现了较大的突破,超越Uniswap V2位于Dex类平台TVL排名的第二位。虽Curve当月持有的TVL增长率不高,但其凭借为多种类别稳定币交易提供低交易费以及CRV代币挖矿,受到大家的欢迎,并一直占据着Dex类平台的龙头地位。但不可否认的是引入新AMM机制,能为流动性提供者提供更多灵活、组合、定制化策略Uniswap V3,让提供流动性的参与者获取更高的收益,未来将会是PancakeSwap甚至是Curve的强力对手。
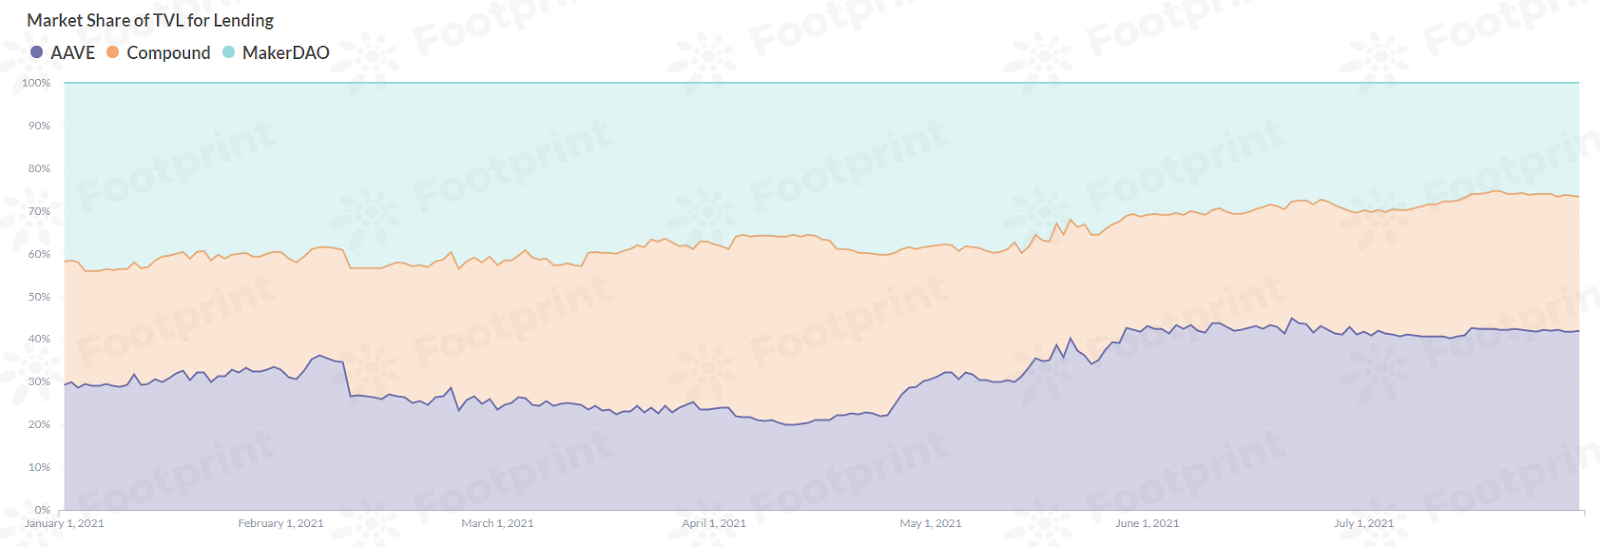
**Aave不断扩大在借贷类平台的市场占有率,TVL突破100亿**
从Footprint提供的数据,Aave7月TVL的表现可以说在众多的借贷平台中遥遥领先,高达119.7亿美金,是首个突破100亿美金的借贷类平台,较6月环比增长27.1%,占市场份额的42% ;Compound7月的TVL虽相较6月增长37.5%,但由于受5月币价的影响TVL腰斩了一半,较高的增长率也仅让Compound的市场份额维持在与6月相对的水平,占市场份额的31%;而MakerDao , 从本年的市场份额变化看一直在缩减,7月仅占市场份额的27%,其市场份额不断被Aave和Compound侵占,龙头地位的作用也不断衰减。
### 二、Lending
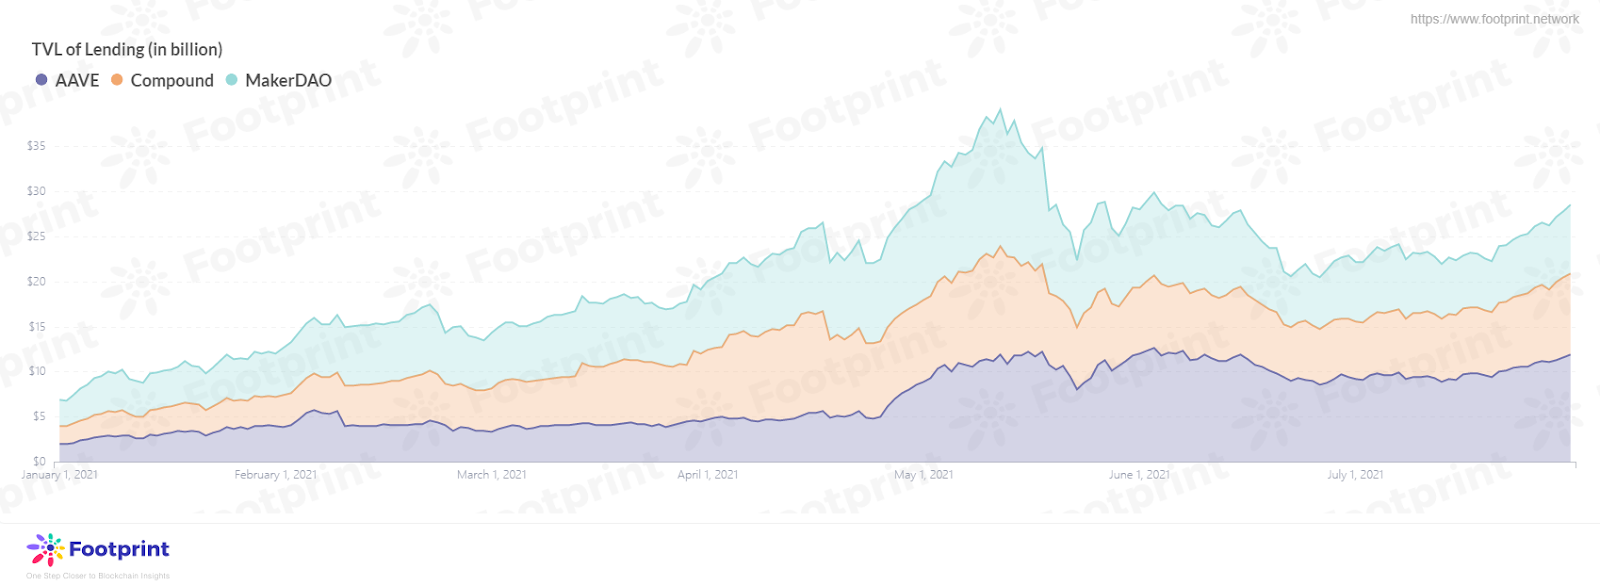
**Aave的Deposit量创新高,Compound的Deposit环比增长74.7%**
从Footprint提供的数据看,7月末头部借贷类平台的Deposit余额为370亿美金,虽未回到5月的历史最高存入量,但随着用户对DeFi借贷类项目认同度、需求度以及协议安全性的提高,预计在8月借贷类平台的Deposit量会创造新的记录。
作为当前借贷类平台的头部,Aave7月的Deposit量已经达到165亿美金,创历史新高,较6月环比增长32.1%,较今年5月创造的148亿美金增长11.3%;紧随其后的Compound在7月也取得不错的成绩,Deposit体量为145亿美金,环比增长74.7%,虽然还未回到5月中旬的174亿美金,但凭借较高增速,8月将会超过5月产生的水平并有可能反超Avva。
反观MakerDAO,5月币价大跌对该平台的影响性是巨大且持续的,5月中下旬Deposit体量经过断崖式下降后,近两个月一直维持在50-60亿美金的范围,7月当其他平台的Deposit量在30%以上的速度增长的情况下,MakerDAO7月的增长率仅有10.3%,远远低于行业的平均增长水平。若期望MakerDAO8月的Deposit体量能回到5月创下的137亿美金,该设想实现的可能性是微小的。
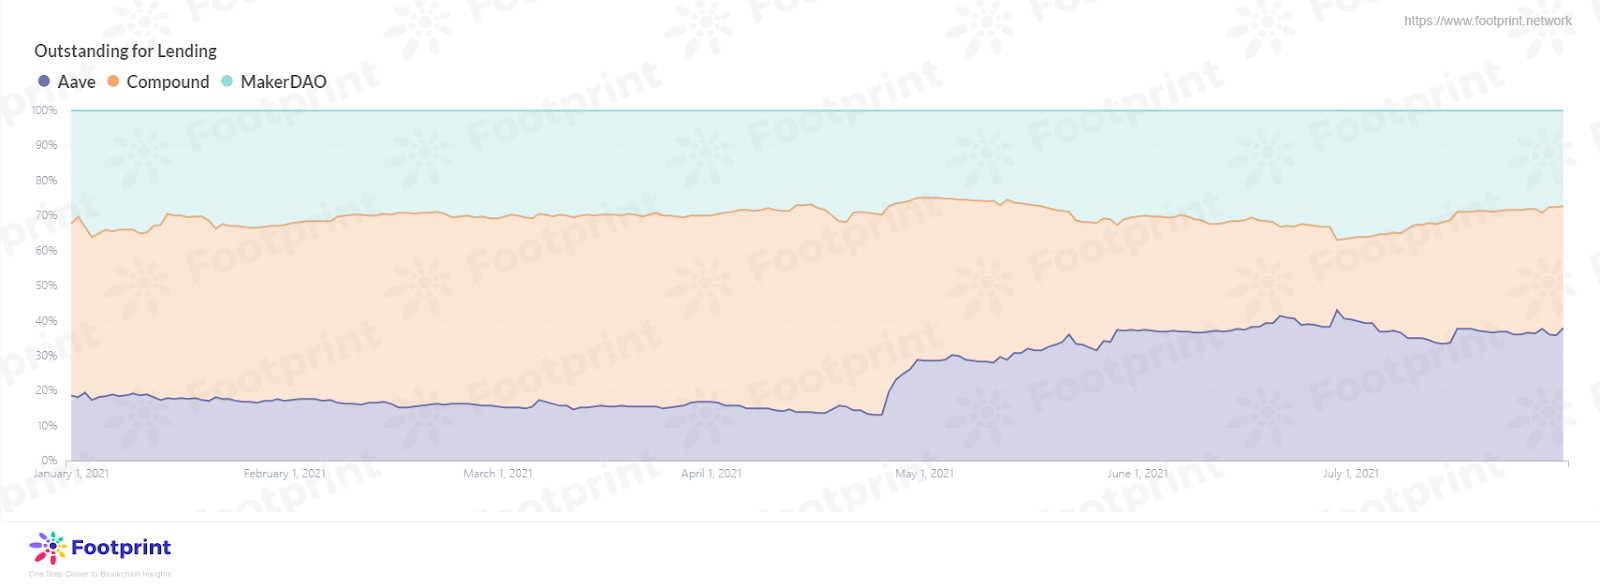
**头部三大借贷类平台在外借贷余额趋于均衡**
7月头部借贷平台出借给用户的在外借贷余额较6月还是有较大的变化,三者从6月的Aave占据较大的债权份额到7月已逐渐趋于均衡。从上文对3大借贷类平台持有Deposit体量的数据中可知,Aave以及Compound是MakerDAO的3倍左右,而当前此三大平台持有的借贷余额市场占有率是趋于均衡的,可知MakerDAO在三者中资金利用率是最高的,借款人存入的资金基本用于出借,但当DeFi行业有一些新动向不利于借贷类项目的发展,那么借款用户被清算的可能性增加,平台的运营风险也随之提高。
### 三、市值
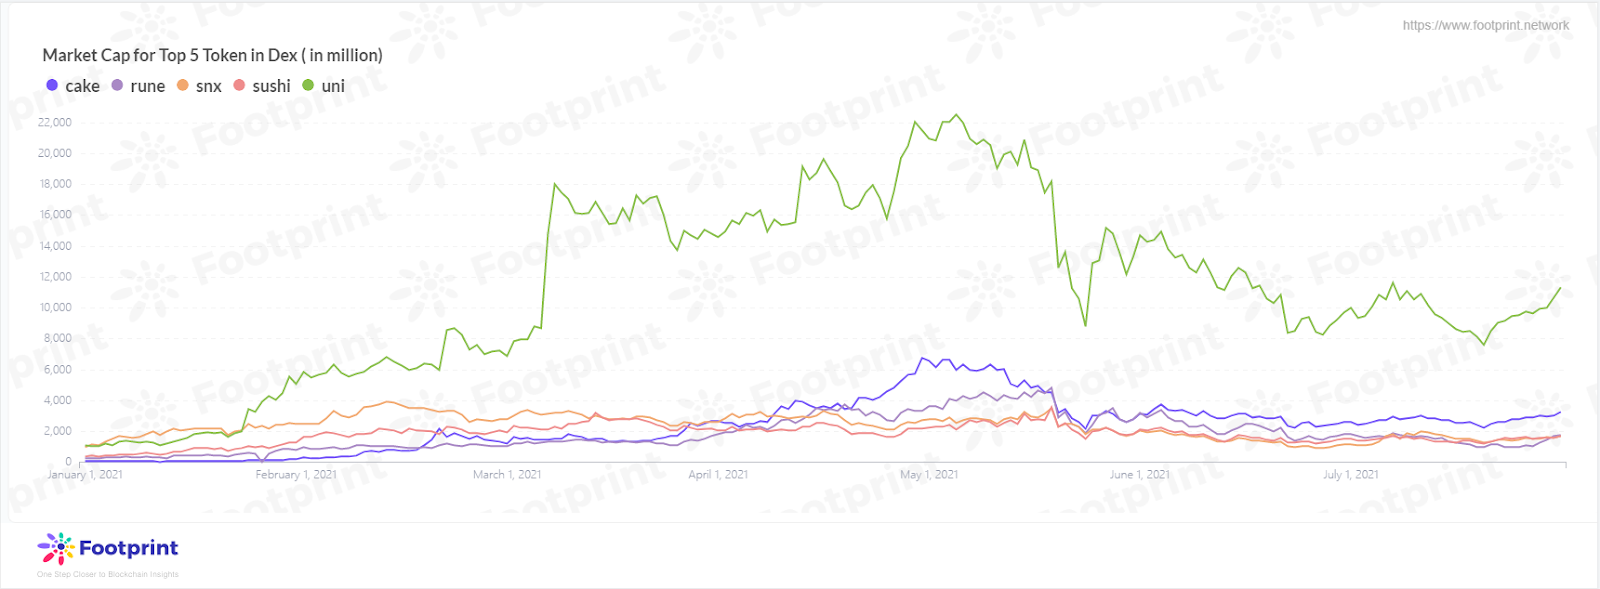
**Uniswap持续占据Dex类平台市值的首位**
纵观7月,Dex类平台Token市值涨幅最高的为Synthetix Network,环比增长46.6%,虽其位于第五位,与位于第四位的Sushiswap仅有140万美金,相信不久Synthetix Network就能超越Sushswapi、THORChain以及PancakeSwap,回到年初的第二位。对于继续保持Dex类首位的Uniswap,虽受币价下跌,7月的市值相较5月的顶峰时期的市值还是有一倍差距,但从上文提到的Uniswap不断做升级迭代,给流动性提供者创造更高的收益,其市值提升未来可期。
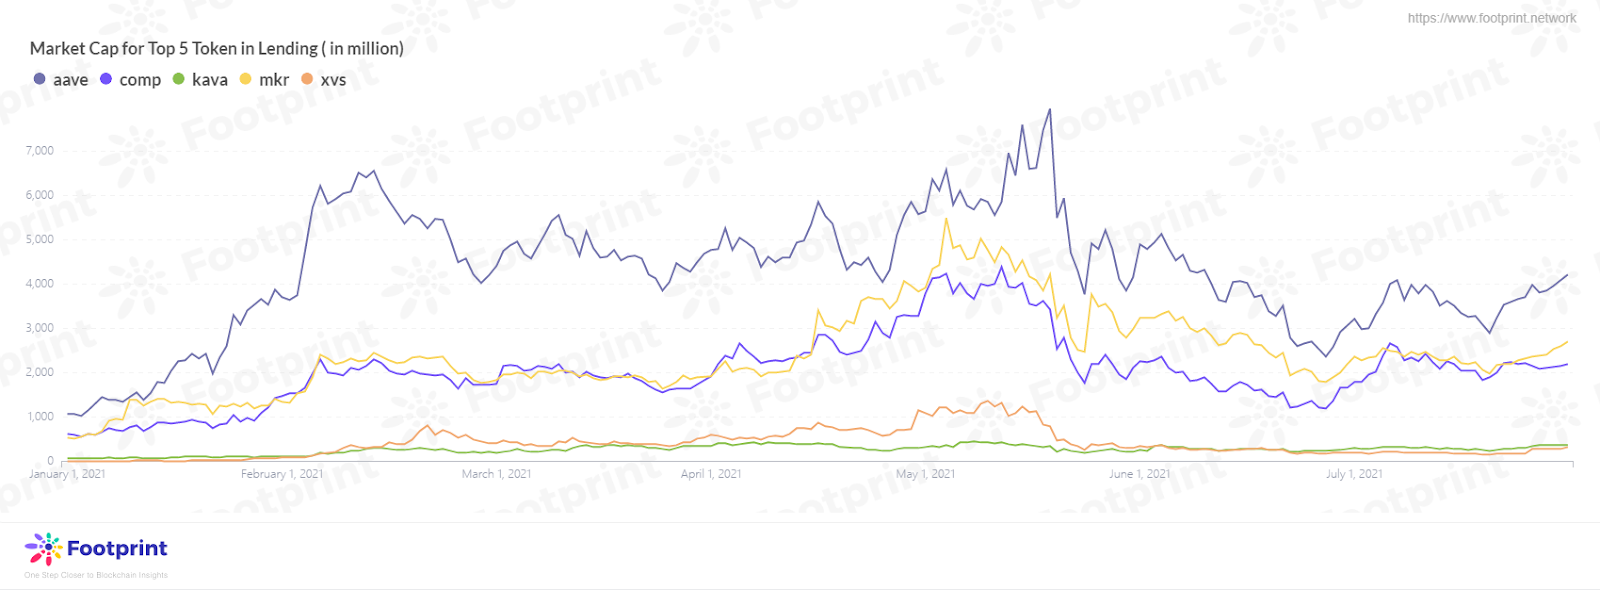
**MakerDAO重回Lending类市值第2位**
与6月不同,7月借贷类平台的展现欣欣向荣的态势。最强势的莫过于AAve,市值为4.2亿美金,较6月环比增长37.5%。位于2-3位的竞争较为激烈,最终MakerDAO在7月末发力,凭借27.5亿美金,以超过Compound5.14亿美金的优势完成逆袭,位于第2位,其当月的增长率也不差,高达23.4%。位于第3位的为Compound,其当月的表现也不差,取得31.2%的增长率,逐步追赶与第2名的差异。位于第4与第5位为Kava与Venus对于前3名差异较大,但其在7月也呈现不同幅度的增长,特别是Venus当月涨幅55.1%。
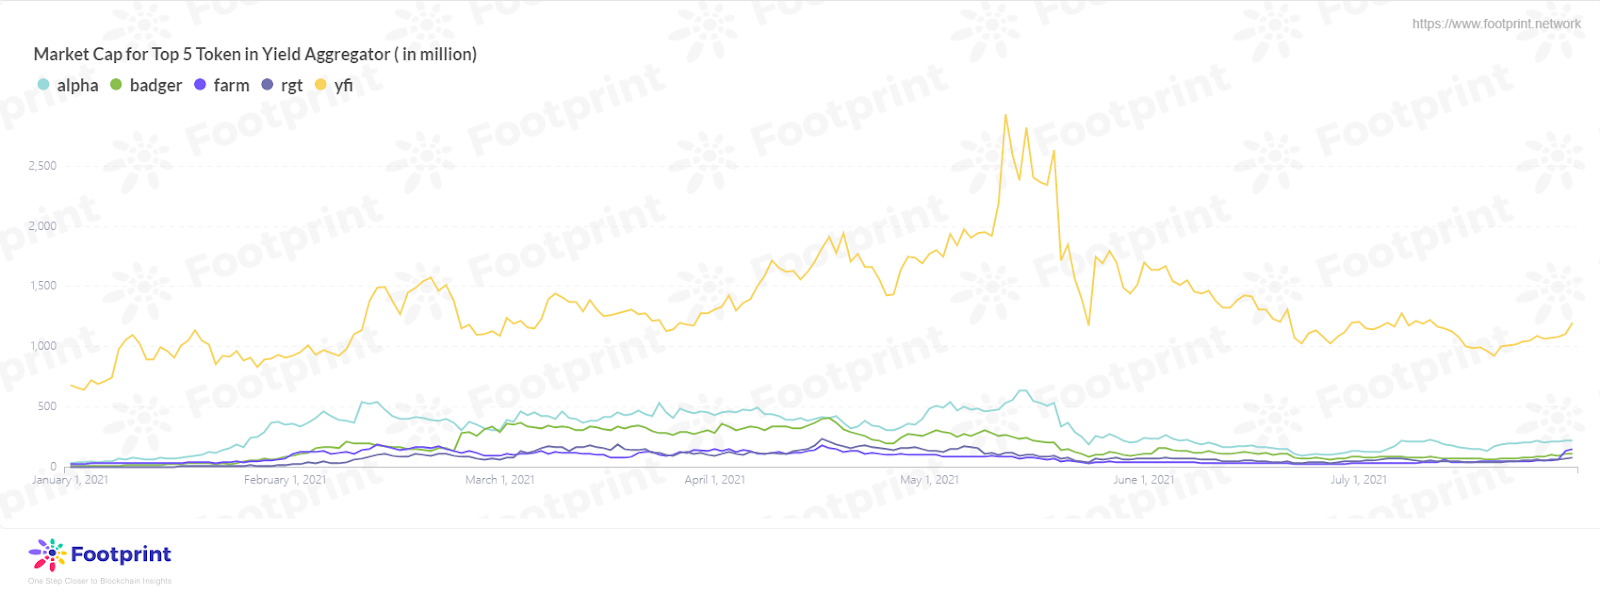
**Harvest Finance7月增长367.7%,势头强劲**
7月表现最好的莫过于Harvest Finance,7月恢复亿级的市值,7月市值为1.48亿美金,较6月环比增长367.7%。紧随其后的为增长65.9%的Rari Governance以及增长64.3%Alpha Finance。随着Harvest Finance、Rari Governance以及Alpha Finance的高速增长,十亿以上级水平的yearn finance市场占有率在逐渐下降,虽然其在7月保持较为稳定的市值(11.97亿美金),但其在前五名机枪池类平台的市值占比已经从6月的80%降到68.1%。
从上述Footprint提供的数据,不同类别的平台、不同指标都显示出7月加密市场在逐渐恢复,不同平台都为营造更好的DeFi应用而努力,我们有理由相信,8月会比7月发展得更好。
除此以外,8月以太链将会完成EIP-1559的硬分叉升级,对在以太坊链的交易拥堵、Gas费用高的情况是否有所改善,让我们期待8月的报告,我们将在8月报告为大家揭晓。
# 2-Footprint 8月月报 DeFi市场多点开花,9月是否会迎来下一个爆发点

**撰文:Vincy\@Footprint Analytics**
**日期:2021/09/09**
随着7月月报[July 2021 Report](https://www.footprint.network/guest/dashboard/ea4ad38d-08e4-41cf-a220-0e0bdfe10c46#secret=ED7A61266A0146012C62304105503058)(点击此处了解详细数据)数据分析,7月的市场逐步恢复,8月的DeFi市场在产品、资金和用户规模上有了质的飞跃,DeFi市场新玩家的涌现,又引起一番热潮。流动性挖矿的代币激励政策推出,锁定在各条公链 DeFi 协议中的总价值也迅速回升,大多数公链中再次刷新历史记录,接下来,将在Footprint 8月月报[August 2021 Report](https://www.footprint.network/guest/dashboard/83ce68ae-a4df-4a39-9033-55782a0db772#secret=F84B4A448579ABD0317AD83BE94FA8D4)(点击此处了解详细数据)的数据指标出发,来回顾DeFi市场的整体情况,预估9月各公链的趋势。
**一、从各公链的数据指标进行分析**


**多条链的TVL呈上涨趋势,Solana和Avalanche新兴公链迅速发展**
据Footprint提供的数据,8月多链的TVL为1,628亿美金,环比增长率为32%。其中以太链以1,260亿美金占据榜首,环比增长率为30%,占市场份额的77%,继续保持其无法撼动的地位,重要的是,以太链EIP-1559的硬分叉升级,引入了一种销毁机制,标志着以太坊历史上极为重要的协议变化,截至8月31日,EIP-1559采用率已占所有以太坊交易的近50%;而BSC TVL环比率27%的增幅,达到190亿美金,从整体的趋势上看,增幅缓慢,还是维持在一个较为稳定的水平。
数年持续开发终于问世的公链为Solana链和Avalanche链 ,截至8月31日,Solana 《[Solana公链:为何能在众多公链中的大放异彩](https://docs.google.com/document/d/1IpalIjIbCseR-gq0PcqYs94J-Pt3xCRqmOKetDr9pIM/edit#) 》和 Avalanche凭借共超过 50 亿美元的锁定资金进入了稳固的市场,环比增长率约200%和900% 。Solana 生态系统的原生加密货币SOL创下历史新高,从7月31日的 36美金到8月31日攀升至 107美金,环比涨幅197.2%;而 Avalanche 代币 AVAX 自今年 2 月发布以来币价最高值为 56美金的数值,在8月24日代币AVAX再次刷新 58美金新高记录,环比7月24日涨幅427.3%。但随着 Solana、Avalanche 等新兴公链的迅速发展,作为 DeFi 的重要组成部分,各条公链上的 DEX 都不可或缺,使整个DeFi领域更具竞争力。\
\
另外我们从TVL排名前两位的以太链与币安智能链进行进一步跨链分析。


**借贷类、资产管理类、机枪池类平台在8月有不同涨幅度**
以太链Top 5平台整体贡献度较7月均呈上升趋势,分别为Aave(121.9亿美金,环比+21.9%),Curve(121.3亿美金,环比30.3%)、InstaDApp(121亿美金,环比+30.8%)、Compound(11.7亿美金,环比+30.5%)、WBTC(9.7亿美金,环比+19.8%)。其中值得一提的是,WBTC如何在众多项目中挤进太链Top 5的平台,将原在7月排行第4位的MakerDAO挤出Top 5位置?WBTC 实现第一种映射代币模式下的比特币资产桥,其运营模式和稳定币非常相似,也是采用中心化托管运营的方式将比特币网络的比特币作为储备金锁定、在以太坊上发行可 1:1 兑换的 ERC20 代币 WBTC,供用户在以太坊网络持有比特币的风险敞口及实现相关的交易。
币安智能链Top 5平台涨幅有升有降,其中对币安智能链最大的平台为Dex 类 PancakeSwap(65.4亿美金,环比-40.2%),Phala Network加入PancakeSwap糖浆池,开启流动性挖矿,总TVL不上升反而还下降,这值得您去思考。那从增长率上看,涨幅变化较大的为Tranchess ,8月TVL已突破12.6亿,环比增长率为950%,为什么Tranchess能在短短一个月内快速增长呢?原因是它能将Queen拆解为两个不同风险回报的子基金产品,从而实现更复杂但高效、公开的链上资产管理方式,满足不同风险偏好投资者需求实现互补。Tranchess还处于初步成长期,没到爆发期,未来可期。
**二、DeFi市场不同类型的指标变化情况**

\
**Dexes、Lending和Yield三大类型已占DeFi市场的45.2%。**
**以下分别从Dex、Lending和Yield三大类型的TVL、Market Share等指标进行分析**
**1、Dexes**

**Curve持续发挥去中心化交易所的作用,Balancer超越Uniswap V3位居第五**
Dex类平台的TVL在8月缓慢上升,分别为Curve(环比+33.1%)是头部Dex类平台涨幅最高的,并一直占据Dex类平台龙头地位,PancakeSwap(环比+19.7%)、Uniswap V2(环比+9.1%)、SushiSwap(环比+28.5%)、Balancer(环比+16.9%)。在8月,Balancer已超越Uniswap V3位居第五,Balancer 初次 token 发售原理同 Uniswap 上的类似,开创了 Liquidity Bootstrapping Pool(流动性引导池),提高了项目方的资金效率,交易池中各资产比例调整而形成的价格压力和参与者购买行为形成的价格上行动力,共同决定了 token 的发售价格,相较于 Uniswap 的机制,Balancer 提供了一个更平衡的价格发现机制。

**Uniswap仍占据Dex类平台市值的首位,但涨幅最高的是PancakeSwap**
从Footprint提供的数据看,Dex类平台Token市值涨幅最高的为PancakeSwap,市值为49亿美元,环比增长49.4%,位居第2位,距离占据首位的Uniswap的市值151亿美元还有三倍的差距,那位居第4位的Sushiswap能否在不久的将来超越Uniswap?因为本月去中心化交易所Uniswap的交易量首次超越了美国最大的中心化交易所Coinbase,这一切都是在一个新兴项目Sushiswap的代币激励下完成的,给用户提供了流动性,那么,后续流动性更好的SushiSwap 可能抢占大量客户,其市值提升未来可期。
### **2、Lending**


**Aave在借贷类平台的市场占有率略微减少,Compound总TVL自今年5月以来再次突破100亿**
从Footprint提供的数据,Aave8月TVL高达142.7亿美金,环比增长19.2%,占市场份额的40%,相对7月,略微减少2%的市场份额,但不影响它在借贷平台中遥遥领先的位置 ;Compound8月的TVL再次突破116.8亿美金,环比增长30.5%,受TVL影响币价也在缓慢回升为515美金,较高的增长率也仅让Compound的市场份额维持在与7月相对的水平,占市场份额的33%;而MakerDao , 从本年的市场份额变化看,一直在缩减甚至维持。

**Aave的Deposit量已超越5月水平,Compound的Deposit环比增长13.33%**
从Footprint提供的数据看,8月末头部借贷类平台的Deposit余额为430亿美金,环比增长16.2%,借贷市场并没有继续快速增长,但也逐步恢复至5月的最高存入量470亿美金。作为当前借贷类平台的头部,Aave8月的Deposit量已经达到190亿美金,创历史新高,环比增长18.8%,已超越5月最高的Deposit量150亿美金,据报道,Aave通过向英国金融服务监管局申请的电子货币机构牌照,Aave用户可以通过法币购买Aave生态中的稳定币和其他资产,它会是9月下一个抵押借贷市场的黑马?其次Compound,Deposit体量为170亿美金,环比增长13.3%;Compound的Deposit量在8月增长不明显,但对借款人来说仍然是一个有吸引力的市场。
反观MakerDAO,由于 DAI 在去中心化应用中的需求,MakerDAO 中的借款量仍在增长,Deposit量维持在60-70亿美金的范围内。

**头部三大借贷类平台在外借贷余额趋于均衡**
8月三大平台持有的借贷余额市场占有率是趋于均衡的,较7月借贷余额市场占有率变化不大。可知MakerDAO在三者中资金利用率是最高的,借款人存入的资金基本用于出借,Maker已经证明了自己是DeFi中最强大的稳定币和借贷市场之一。\
\
\

**Compound重回Lending类市值第2位**
8月末前五名Lending类平台的市值为81亿美金,环比下降了16.9%,最强势的莫过于Aave,市值再次突破为51亿美金,环比增长20.7%,是Lending类涨幅最大的平台。而Compound已重回Lending类市值第2位,市值为24亿美金,较7月环比增长7.7%,涨幅不明显,但将上月位居第2位的MakerDAO挤出Top 5的高位。要说的是,本月涨幅最大的Token TRU,环比276.6%,市值对比上月翻了几翻,那TrueFi的崛起,无疑是引入可借款人信用审核机制,5月份以来,TrueFi上的借贷量出现了大幅增长,未来,TrueFi还将对借贷资产进行扩充,让大部分ERC20资产都能作为借贷资产,生成借贷池。\
\
**3、Yield**

**机枪池类平台在8月有不同涨幅度,“气势”最猛的是Tranchess**
从Footprint提供的数据看,截止8月31日头部机枪池平台TVL为177.8亿美金,环比增长47.5%,比借贷市场环比增长率多2倍,其中Convex Finan(72.4亿美金,环比+59.2%),占据Yield类平台龙头地位;另外涨幅最大,“气势”最猛的是Tranchess(12.6亿美金,环比+950%),原因在本文分析BSC链中有提及;Autofarm(31.3亿美金,环比+25.9%),从6月初上线至8月,TVL已达31亿美金,发展趋势迅速,位居Yield类平台第三。

**PEAKDEFI 8月增长271.45%,势头强劲**
8月表现比较好的是PEAKDEFI,市值为3亿美金,环比增长271.45%,在8月25日已赶超了ApeSwap Finance的2.5亿的市值,在8月末市值已接近了Illuvium,未来9月是否能在短时间内赶超Alpha Finance?敬请期待。而Yearn Finance的市值较比7月有些起色,市值为13.7亿美金,环比增长了13.35%,位居机枪池类平台的首位。
从上述Footprint提供的数据,DeFi从以太坊往其他链上扩张已经形成趋势,在不同程度上解决以太坊的问题,同时给更多用户提供一个健康又完整的环境。8月涌现新晋的玩家,期待9月各公链的发展,是否会出现更惊艳的“爆发点”?
除此之外,9月初出现大部分的代币下跌,对未来市场会带来怎么的影响?让我们期待9月的报告。
**回顾8月各类事件:**
1. 链:
1. Avalanche Rush将发放超1.8亿美元的DeFi奖励
2. Avalanche 将 SushiSwap 纳入流动性挖矿计划 Avalanche Rush,总奖励为 1500 万美元
3. OEC链上总锁仓量突破20亿美元
4. Poly Network攻击者以42000ETH的价格购买Crypto Punk 3100
5. Poly Network攻击事件被盗资金已被全部退回
6. Avalanche 总锁仓量达 20.1 亿美元,22 日至 25 日三日内流入 10 亿美元
7. Polygon 第一次全球黑客松将于 8 月 30 日在 HackerLink 开幕,总奖金为 10 万美元
8. Celo 也于 8 月宣布联合 Aave 和 Curve 等推出超 1 亿美元的“DeFi for the People”项目,旨在实现 DeFi 在移动端的使用
2. 稳定币:
1. Uniswap、Curve持有的稳定币占比已经达到中心化交易所水平
2. Solana市值超越USD Coin位列第八
3. Tether 在波场网络增发 10 亿枚 USDT
3. 交易量:
1. 月DEX交易量为725.4亿美元,环比下降15.4%
2. DeFi锁仓量突破1570亿美元,创历史新高
4. Gas fee
1. EthHub联合创始人:一旦EIP-1559实施,第1层上的每笔DEX交易都必须以ETH支付gas费用
2. 以太坊开发者trent:用户尝试新EIP-1559功能等5大原因导致gas价格高
3. 以太坊核心开发者:EIP-1559将ETH的年通膨率从4.2%降低到2.6%
4. EIP-1559采用率已占所有以太坊交易的近50%
5. NFT:
1. NFT交易市场OpenSea 8月累计交易量达5.47亿美元,较7月交易量增长68%
2. Axie Infinity过去30天内协议收入超10亿人民币,是排名2-10位总和的7倍
3. CryptoPunk过去一周平均交易价格上涨68.2% 总交易量超1.2亿美元
4. NFT市场OpenSea上周末交易量接近1亿美元
6. Lending
1. DeFi借贷协议Aave V2锁仓量突破110亿美元,创历史新高
2. Maker借款总量突破60亿美元,创下历史新高
7. Dex
1. Uniswap V3推出模拟V2的全范围流动性功能
2. DEX7月份交易额为560亿美元,65%来自Uniswap
3. O3 Swap 重启 USDC 跨链池,并宣布给支持者奖励 NFT
8. Ethereum Gas
1. 截止以太坊伦敦硬分叉升级完成后,12小时内燃烧以太坊数量3200枚
2. 以太坊销毁ETH总价值击穿4亿美元,销毁量超12.6万枚
关于Footprint
Footprint是一个一站式可视化区块链数据分析平台。
Footprint将用户体验放在第一位,它提供了一个直观简洁的用户界面,可以通过拖拽式数据交互,进行查询和可视化数据分析。无论是数据分析师、数据科学家、开发人员、学生、教师、管理者还是项目方,都可以迎合自己的需求,轻松使用这一强大的数据分析工具。
Footprint网站:
Discord社区:
微信公众号:Footprint区块链分析 (FootprintDeFi)
# 3-Footprint周报:比特币再破6万美元,创5月19日后新高

撰文:Footprint分析师Simon()
日期:2021年10月10日-10月16日([详细数据可点击链接](https://www.footprint.network/guest/dashboard/33edf523-681b-47fa-be7d-fb6379c84205?date=2021-10-09#name=Weekly%20Report%20Dashboard\&secret=8311A15A2E5D46AACDC1747460437BF0))
**本周排行榜:**
TVL大于100M且上线超过30天的协议中,本周上涨最快的是Beefy Finance,属于Avalanche链,7天上升了152.8%,30天上升了422.82%。
本周主要链增长最快的协议:
以太坊:Synapse,当前TVL为1.1亿美元,7天上涨了84.94%
币安链:Planet Finance,当前TVL为4.5亿美元,7天上涨了85.14%
本周前主要类别增长最快的协议:
DEXes:Serum,当前TVL为14.8亿美元,7天上涨了99.96% Lending:
Larix,当前TVL为2.4亿美元,7天上涨了62%
Yield:Beefy Finance,当前TVL为1.7亿美元,7天上涨了152.8%

**本周概况:**
**I.TVL**
本周总体TVL为2293.2亿美元,较上周上升6.39%
本周TVL排名第一为以太坊(1534.2亿美元),市场占有率高达66.9%,紧随其后是币安链(205.1亿美元)和Solana(110亿美元)。

TVL在10亿以上的链中,上升最快的是Avalanche,上升比例是30.84%,其次是Solana上升11.96%,第三是Waves上升11.91%。

从类别上划分,第一为DEX类,TVL为676.3亿美元,本周上升6.79%。
各协议中,TVL最高的为Curve(157.1亿美元),本周上涨7.51%;第二为MakerDao(157.1亿美元),本周上涨12.15%。

**II.Token**
本周币价第一的为BTC,价格为61245美元,本周上升11.32%,近30天上升28.46%。 本周链的代币价格,第一位ETH(3840.96美元);本周上升最快的为MATIC,涨幅为11.11%,当前金额1.5美元。

本周代币的Market Cap前3为BTC、ETH、BNB,分别占据市场的44.7%、17.66%和3.06%。

TVL前20的协议中,目前MC/TVL最低的为INST,MC/TVL为0.01,协议目前被低估,目前最高的为UNI,MC/TVL为1.81。 注:MC/TVL仅为衡量平台指标之一,用户还需结合协议整体情况进行评估。
本周DEX、Lending、Yield类型中价格最高的平台代币分别为QUICK、INV、YFI,价格分别为410.68美元、780.69美元、35162美元。
**III.Gas**
本周使用了43718个区块,比上周下降了253个区块,使用数量变化不大。本周Gas费总消耗77327.32 ETH,较上周下降5.06%;总燃烧65321.45 ETH,较上周下降7.81%。 本周选择交易类型为2,即使用EIP-1559的用户占比58.84%,较上周上升0.35百分比。

Gas费VS燃烧费(2021年10月16日) 数据来源:Footprint Analytics
一周要闻:
10月10日
● 俄罗斯地方法院裁决17家加密货币交易所网站信息非法,网站或面临关闭
● 元宇宙项目 Treeverse 以2500万美元估值完成种子轮融资, IdeoCo Labs 和 Animoca Brands领投
● 以太坊L2网络总锁仓量为32亿美元
10月11日
● Fantom 上总锁仓量突破50亿美元
● 算法固定利率借贷平台Dank协议通过Certik安全审计,将上线Arbitrum
● 区块链分析公司Elliptic完成6000万美元C轮融资,Evolution Equity Partners 领投
10月12日
● 雪崩协议首个跨链DEX HurricaneSwap主网上线
● Polygon推出「Swap For Gas」,可将ETH、DAI或USDT零Gas费兑换为MATIC代币
● 法国加密经纪商SheeldMarket完成1000万美元A轮融资,Atomico领投
● 加密借贷平台Celsius完成4亿美元融资,WestCap和CDPQ领投
● 去中心化期货交易平台Futureswap获得1200万美元A轮融资,用以扩大团队及发展平台
10月13日
● 美国比特币算力超全网算力的35%,位列世界第一
● 股权众筹平台Republic的加密部门Republic Crypto推出6000万美元种子基金
● 比特币矿业公司Stronghold Digital计划在IPO中融资9400万至1.06亿美元
10月14日
● 以太坊销毁的ETH总价值突破20亿美元
● 被动收益协议Indexed Finance的DEFI5andCC10池遭到攻击,损失达1600万美元
● SushiSwap在Celo上完成部署,并合作推出1260万美元流动性挖矿奖励
● TradingView以30亿美元估值完成2.98亿美元融资,老虎基金领投
10月15日
● 比特币突破6万USDT
● 美国商品期货交易委员会要求Tether和Bitfinex支付4250万美元罚款
● 投资应用程序Plum在A轮融资中获1400万美元资金,计划于2022年推出加密产品
10月16日
● FinCEN报告:2021年上半年勒索攻击金额逾5.9亿美元,超2020年全年
● 风投公司Tribe Capital计划推出7500万美元的加密基金
Footprint Analytics官网:;
Discord社群:;
微信公众号:Footprint区块链分析 (FootprintDeFi)
关于Footprint Analytics:
Footprint Analytics是一个一站式可视化区块链数据分析平台。Footprint协助解决了链上数据清理整合的问题,让用户免费享受0门槛的区块链数据分析体验。提供千余种制表模板和拖拽式的作图体验,任何人都可以在10秒内建立自己的个性化数据图表,轻松洞察链上数据,了解数据背后的故事。